After publishing the MicroBlaze Configuration for an RTOS article series, we received some feedback as well as a few questions related to the performance of the Xilinx MicroBlaze soft CPU core. Following those, we thought it would be a good idea to publish a few articles containing benchmarks of the MicroBlaze in different configurations. This first article will look at the core performance using the popular CoreMark benchmark from EEMBC.
Note from the author:
This is one of the first articles inspired by readers’ feedback and questions. Going forward, I would like to write more articles answering questions received from readers. If you have any feedback or topics, you’d like to be covered do not hesitate to contact us by email at blog@jblopen.com.
You can also look forward to articles written by other members of the JBLopen team in the near future. If you want to be notified when these articles are published feel free to follow us on Linkedin, Twitter, Facebook, or your favourite RSS reader.
As mentioned in the introduction, following some positive feedback from readers I thought it would be a good idea to publish a few benchmarks on the MicroBlaze. This first article will deal with core performance measurement using CoreMark, you can also expect additional articles looking at memory bandwidth and latency as well as RTOS performance on the MicroBlaze.
About CoreMark
CoreMark is a benchmarking program published by EEMBC designed to measure core CPU performance. As its name suggests, CoreMark is not designed to measure overall system performance but instead looks at a core CPU performance which is the subject of this article. CoreMark is well suited to compare the various MicroBlaze implementations which differ in pipeline length. As stated, it is not designed to directly measure the cache and memory hierarchy performance, however I will show some benchmarks using DDR and AXI external memory with caching disabled to show the impact of memory latency on core performance.
Setup
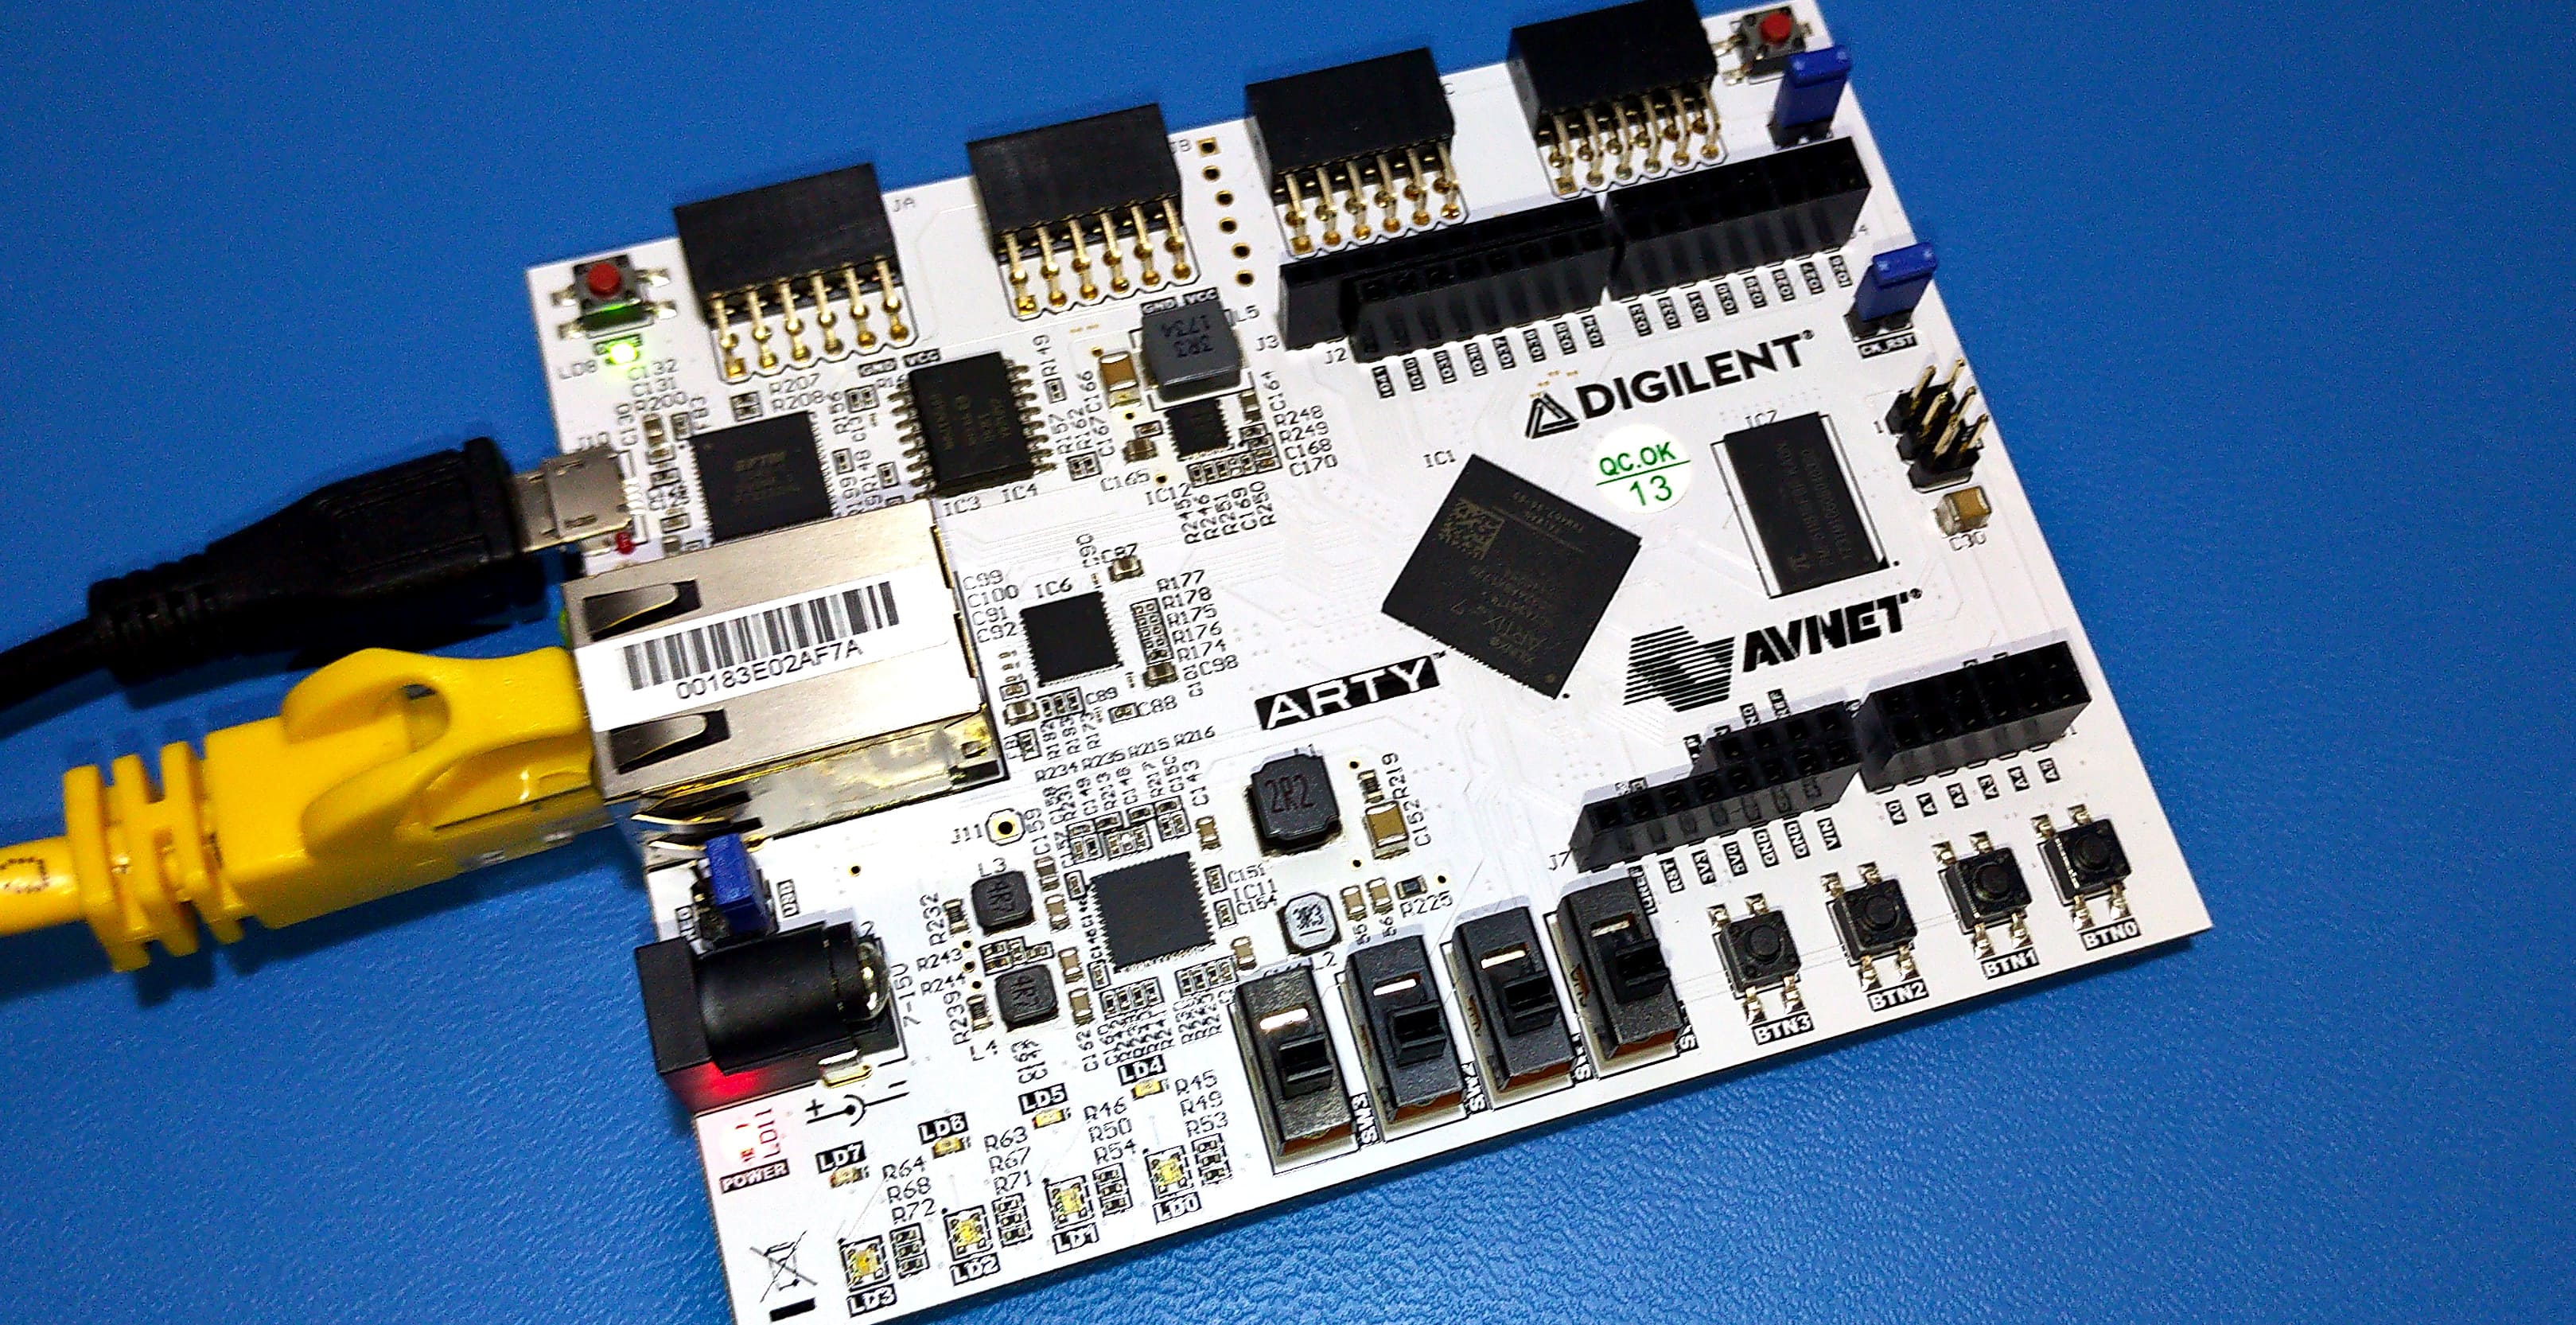
Unless mentioned otherwise all the benchmarks were done using version 11.0 of the MicroBlaze running at 100 MHz on the Digilent ARTY A7-35. DDR memory, when relevant, was clocked at 667 MHz. Note that this means there is a clock synchronization stage between the MIG AXI user interface running at 83 MHz and the MicroBlaze buses running at 100 MHz. For this benchmark this makes little difference, however.
Compilation was performed using GCC 8.2.0 with the following compiler flags:
-O3 -std=gnu99 -mcpu=v11.0 -mlittle-endian -mxl-barrel-shift -mxl-pattern-compare -mno-xl-soft-div -mno-xl-soft-mul -mxl-multiply-high -Wl,--no-relax -ffunction-sections -fdata-sections -Wall -pedantic -Wconversion
Also all the MicroBlaze cores were configured to include the following instruction features:
- Barrel shifter
- 64-bit integer multiplier
- Integer divider
- Additional machine and status register instructions
- Pattern comparator
- Reverse load/store and swap instructions
When cache is included for the test, the following configuration was used.
- 8 KiB instruction cache
- 8 KiB data cache
- 4 word line length
- Writeback storage for the data cache
- Data width full cache line*
- 1 instruction steam*
- 8 instruction cache victim slot*
- 8 data cache victim slot*
* Those features are not available for the AREA optimized implementation.
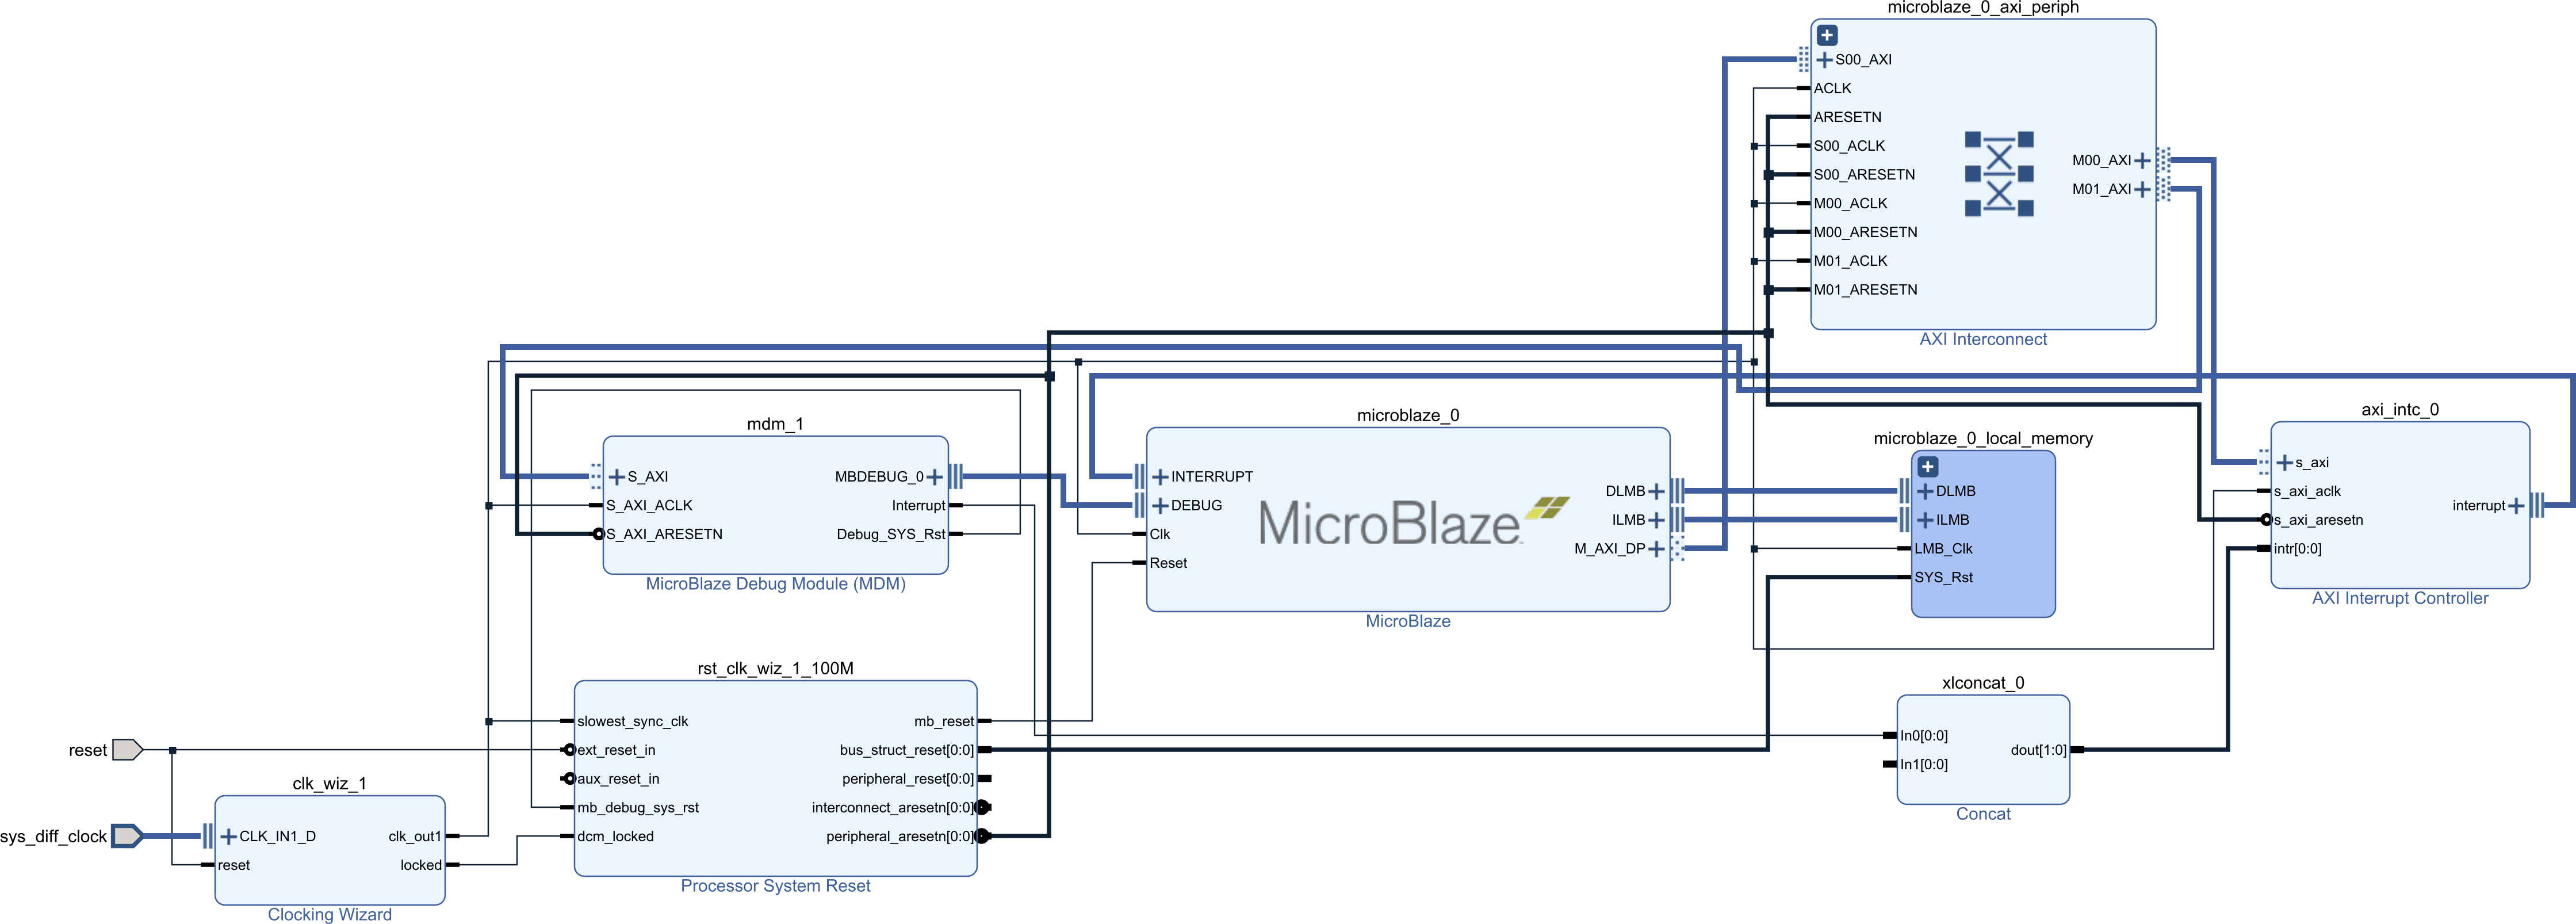
Benchmarks from Local Memory
The local memory of the MicroBlaze can be accessed in a single cycle. This single cycle access effectively removes the impact of the memory hierarchy on the core performance. Note however, that with different pipeline configurations the MicroBlaze may take more than one cycle to execute a load or store instruction on top of the memory latency.
The MicroBlaze has two important parameters that deeply impact the core performance. The implementation optimization, which changes the pipeline depth as well as branch prediction. The three implementation optimization choices, AREA, PERFORMANCE, and FREQUENCY results in a 3, 5 or 8-stage pipeline respectively. Aditionally, branch prediction is available for the PERFORMANCE and FREQUENCY implementation and attempts to reduce the average cost of taken branches.
Results:
| Configuration | CoreMark | CoreMark/MHz |
|---|---|---|
| Area | 199.85 | 2.00 |
| Performance | 211.98 | 2.12 |
| Performance + BP | 224.22 | 2.24 |
| Frequency | 133.11 | 1.33 |
| Frequency + BP | 160.69 | 1.61 |
The results show that the 5-stage, performance optimized pipeline, performs slightly better than the 3-stage area optimized pipeline. The 8-stage, frequency optimized pipeline performs worse than the two other implementations. Since memory access latency is not an issue here, the difference is mostly due to the 5-stage pipeline having more single-cyle instructions compared to the 3-stage pipeline. The 8-stage pipeline suffers from increased branch penalty and the higher likelihood of pipeline hazards, requiring some pipeline stages to stall more frequently to wait on other stages.
Since memory access is very fast in this configuration, the impact of branch prediction on the 5-stage pipeline is relatively low. An increase in performance of about 6% when branch prediction is enabled. However the 8-stage pipeline sees a 20% increase in performance when using branch prediction. This shows the relative effect of a higher branch misprediction penalties, meaning that in this configuration and for this benchmark, branch prediction has a more profound effect in situations where branch penalty is higher.
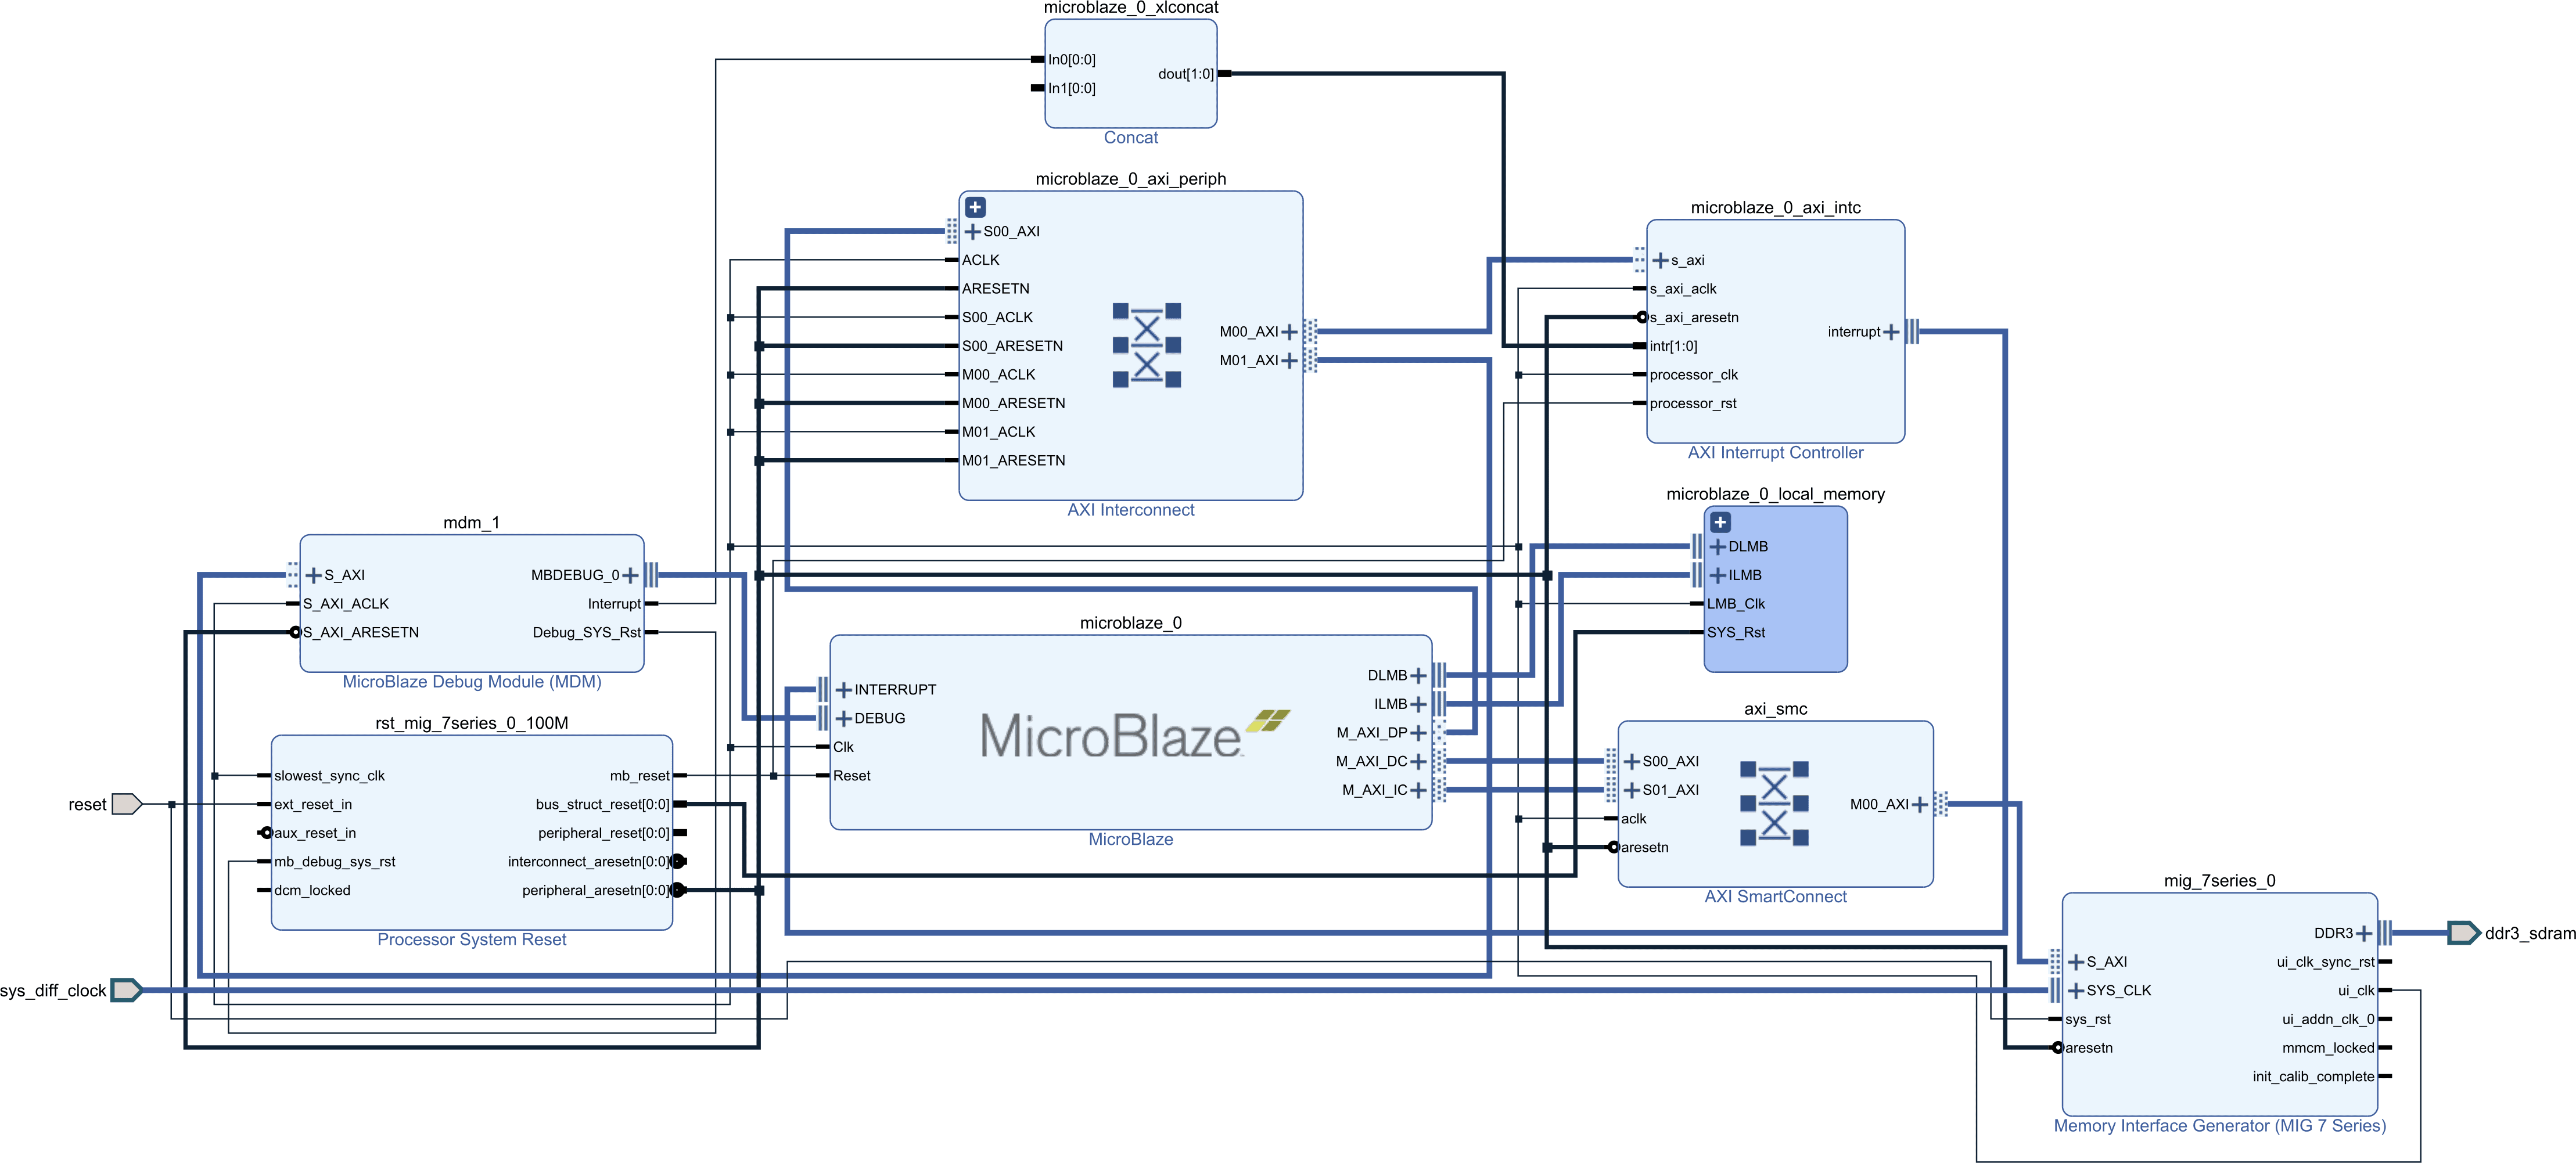
Performance From External DDR Memory
For comparison purposes let’s look at the core performance with code and data residing in external DDR memory. In this situation there are three scenarios to consider. One where the DDR memory is connected to the peripheral data and instruction buses, in this case caching is not available. Another scenario is where the DDR memory connected to the cached interface buses of the MicroBlaze with the cache disabled and finally a scenario where caching is fully enabled.
Branch prediction is enabled for the frequency and performance optimization implementation in the following results.
| Configuration | CoreMark | CoreMark/MHz |
|---|---|---|
| Area | 3.62 | 0.036 |
| Performance | 2.91 | 0.040 |
| Frequency | 3.29 | 0.033 |
| Area + Cache | 183.42 | 1.83 |
| Performance + Cache | 205.32 | 2.053 |
| Freqency + Cache | 108.33 | 1.083 |
As expected, the performance impact of not using caches is enormous when running from DDR memory. With performance being reduced by nearly 80% in some cases. The performance with cache enabled is close to what was measured when using local memory, which is normal for CoreMark. The differences between the cached and local memory results are probably caused by the low associativity of the MicroBlaze cache and in a smaller measure by the small size of the cache.
Perhaps not surprising, but interestingly enough, the performance with cache disabled and the DDR connected to the cache interface is very similar to the performance with the DDR connected to the peripheral AXI buses where no caching is possible.
AXI Block RAM
As I mentioned in a previous article on the MicroBlaze memory hierarchy, running with code and data in external AXI block RAM is rather wasteful and is rare in practice. Especially rare would be to connect the block RAM to the cache interface of the MicroBlaze. But for the sake of completeness and also as a comparison to the DDR memory, I’ve measured the CoreMark performance using the same three scenarios as the DDR memory covered above.
| Configuration | CoreMark | CoreMark/MHz |
|---|---|---|
| Area | 25.79 | 0.2579 |
| Performance | 25.54 | 0.2554 |
| Frequency | 26.58 | 0.2658 |
Performance with caching is similar to the DDR case. However, the difference between connecting the AXI BRAM to the AXI peripheral buses is considerably better than connecting it to the cached interface with cache disabled. In the tested case, it may be due to the width of the cache memory interface being 128 bits wide. Also in the same configuration, the AREA optimization performs poorly even with caching enabled. I haven’t really looked into it since this is not a configuration that should happen in practice. We can conclude however, that when a region of external memory is required, for example to share with other DMA masters, it should probably be connected to the peripheral AXI interface instead of the cached memory interface.
I hope you enjoyed this article on the MicroBlaze performance, stay tuned for further articles on the subject.
Click here for the next article in this series looking at the memory performance of the MicroBlaze.
Questions or comments?
Do not hesitate to contact us at blog@jblopen.com. Your questions, comments and, suggestions are appreciated.