In this article, we discuss 4 popular file systems for both NOR and NAND flash, commonly used in bare metal and RTOS-based embedded systems: LittleFS, Yaffs, FileX and TSFS. We provide a brief description of each file system and compare their performance, RAM consumption and other specific advantages and limitations.
There are plenty of other file systems and storage solutions out there: we cannot possibly evaluate all of them. The file systems that we present here were selected based on their availability and popularity, and based on the fact that they target roughly the same market. Other notable and comparable file systems are Segger emFile and Tuxera EdgeFS, which both offer raw NOR and NAND flash support.
Note that TSFS is our own file system. This is irrelevant to our conclusions, which lean heavily on hard data and easily reproducible benchmarks, but we thought we should mention it for the sake of transparency.
Beyond our own conclusions, we hope that this article demonstrates how to think about flash storage and file systems, shed some light on crucial reliability and performance aspects to look out for, and can serve as blueprint to evaluate other solutions.
Introducing LittleFS, Yaffs, FileX and TSFS
LittleFS is an open source (BSD-3-clause license) file system primarily designed for NOR flash. NAND flash support is incomplete as we will explain shortly. It prioritizes low RAM usage over performance and is best suited for small platforms and very light workloads. Read accesses are reasonably fast but write performances are generally poor. Random write accesses, in particular, are barely even possible given the extremely high level of write amplification and the correspondingly low throughput.
Yaffs is a dual-licensed (GPL and commercial) file system primarily focused on NAND flash devices, although it is commonly used and offers very good performances on NOR flash as well. It can run on a variety of host platorms, including Linux-based systems, as well as bare-metal and RTOS-based systems. Yaffs keeps the entire file system structure in RAM, producing high performances at the expense of a larger footprint.
FileX is an open source (MIT license), fail-safe implementation of the FAT file system. FileX does not support raw flash on its own. Raw flash support is achieved through a separate flash translation layer called LevelX. LevelX comes in two flavours: LevelX for NOR and LevelX for NAND, which are two completely separate code bases, with different limitations and contrasting performance characteristics. The FileX/LevelX combination provides decent performances on NOR flash, although some workloads can be problematic on memory-constrained platforms. Also, LevelX NOR uses byte-level accesses and multi-pass programming to reset bits inside a page that was already programmed without prior erasing. That does not work on all devices, or could require that the built-in ECC be turned off. On NAND flash, LevelX exhibits a very high write amplification, which makes for very low write performances and short life expectancy.
TSFS is a commercially licensed transactional file system for bare-metal and RTOS-based systems with native support for raw flash (NOR and NAND). It produces the highest overall performances of the bunch, including for small accesses down to 256 bytes on NOR flash. Unlike Yaffs, TSFS exhibits near-constant RAM usage with regards to the device size. TSFS also supports managed flash devices like SD card and eMMC.
Comparison Summary
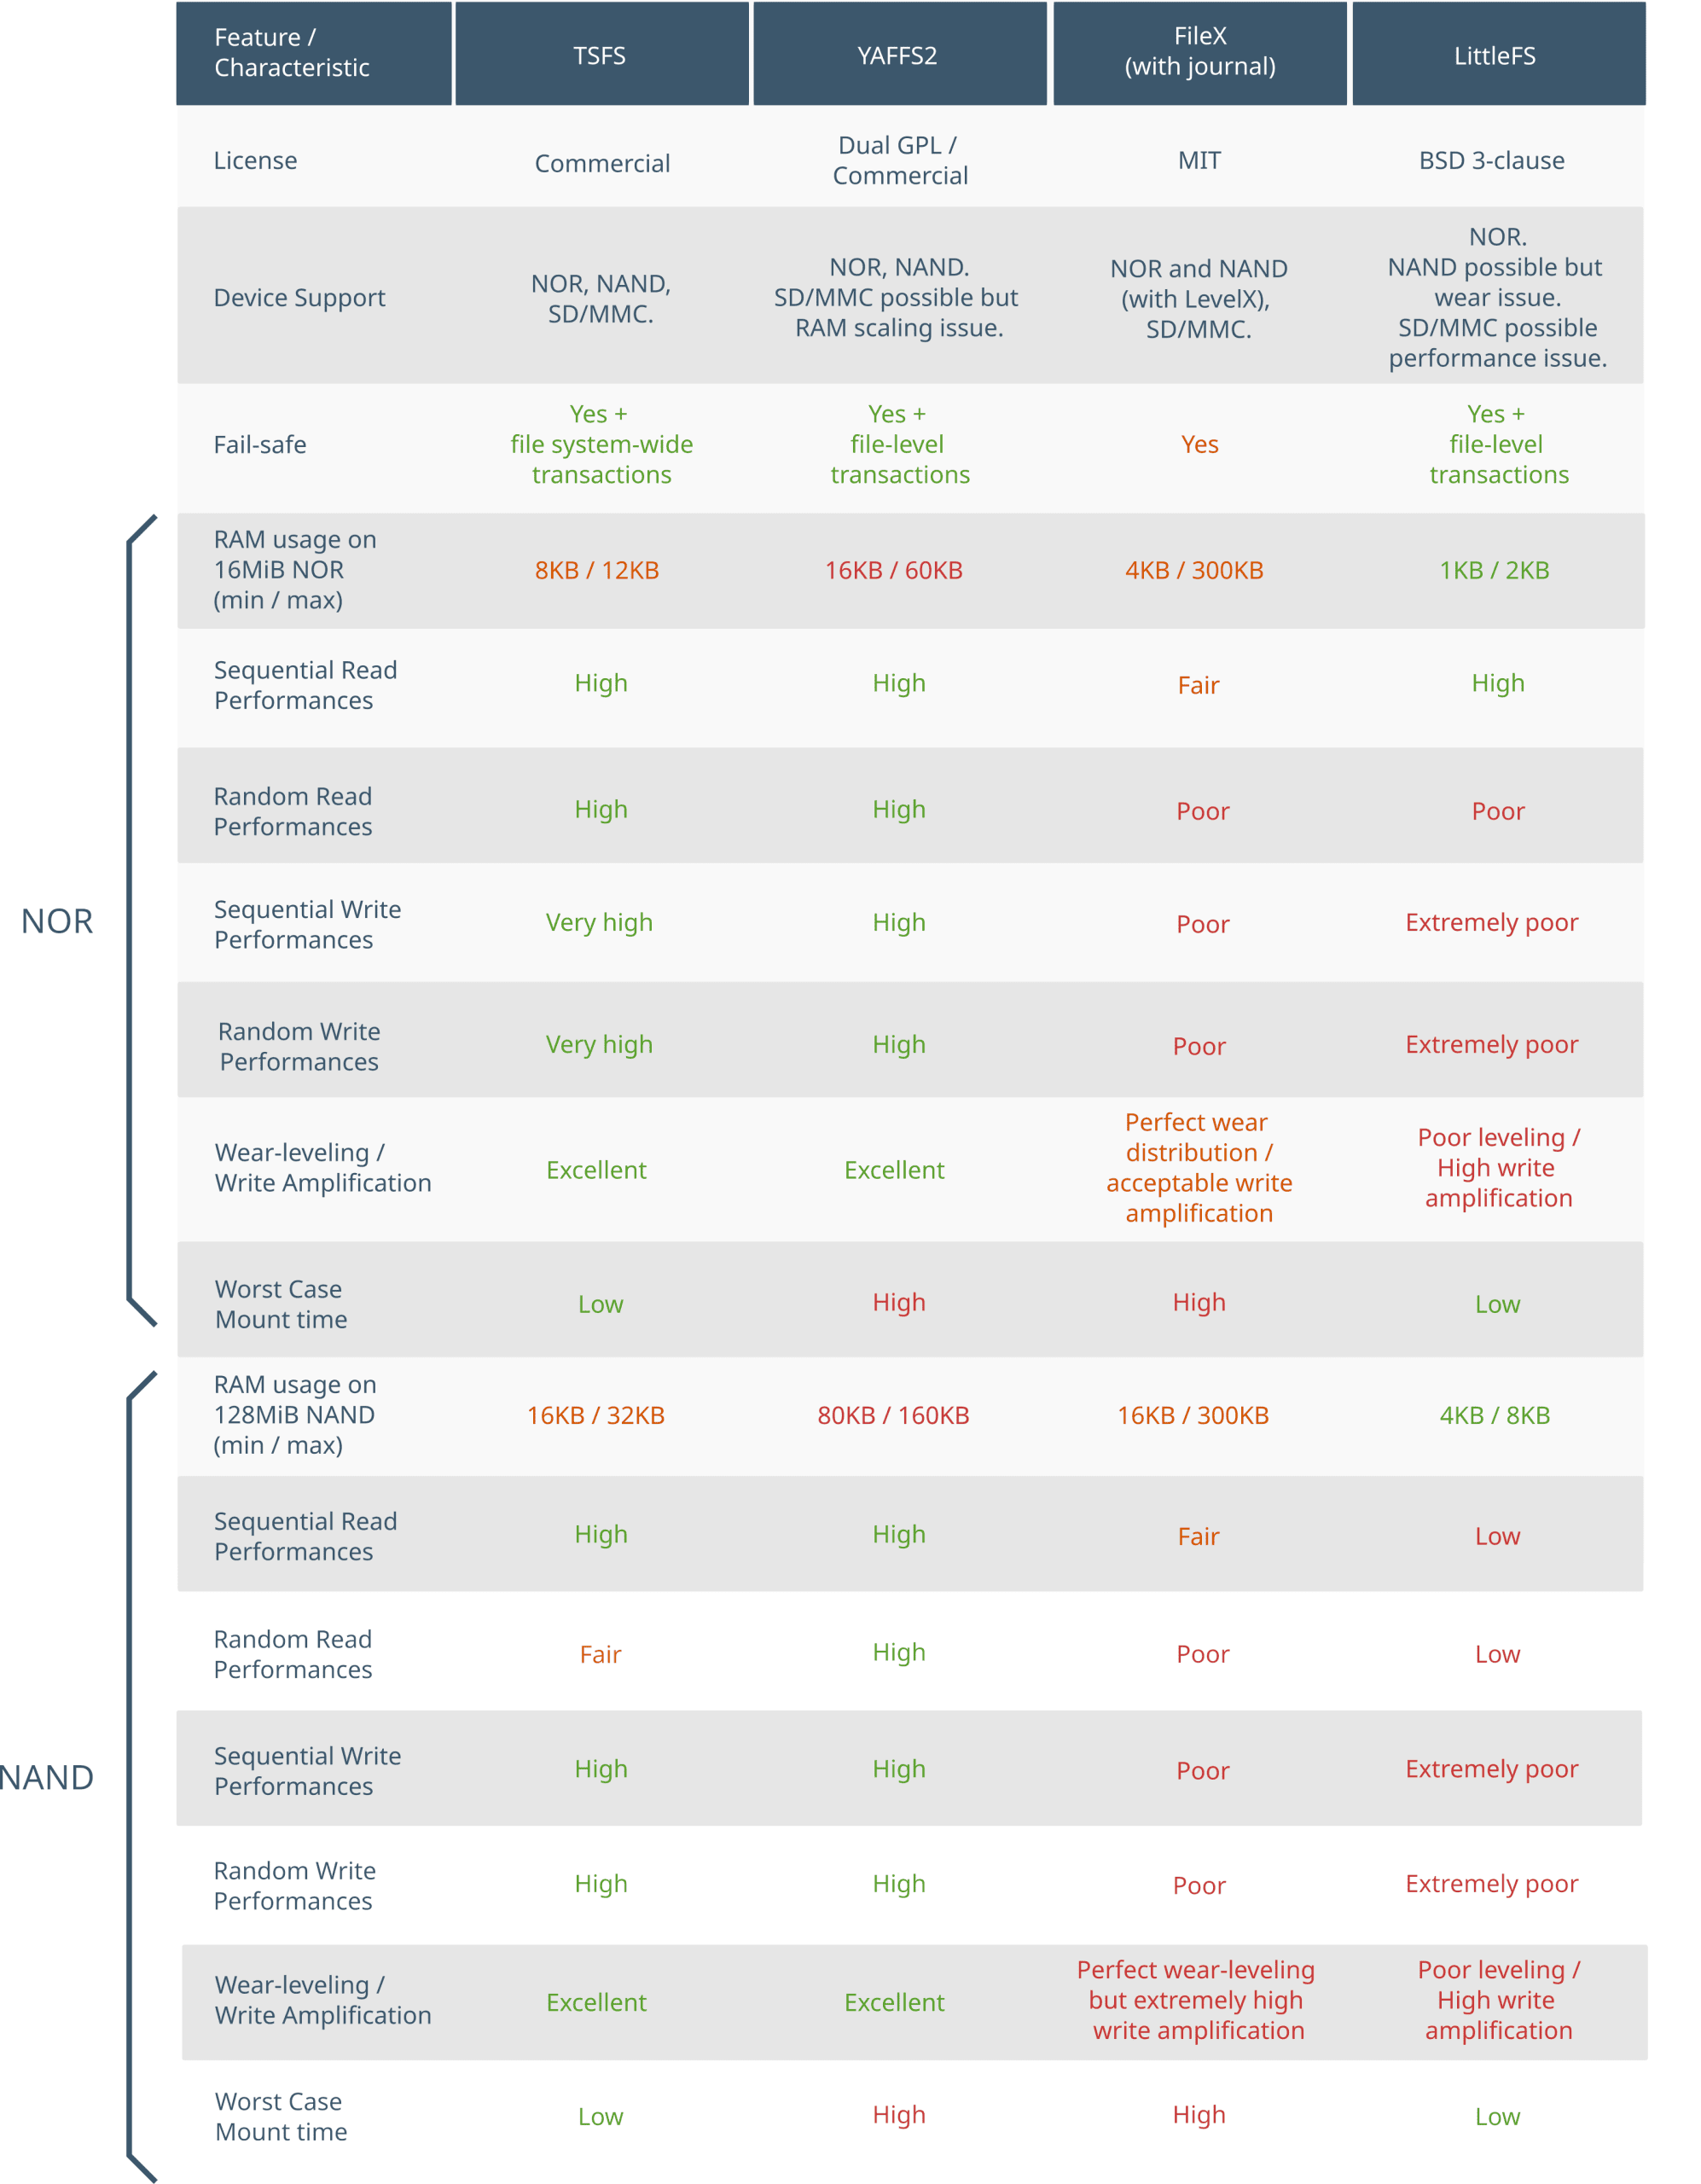
Figure 1 summarizes how LittleFS, Yaffs, FileX and TSFS compare in terms of important file system characteristics. The rest of this article details how we came to these conclusions. To improve readability, the following color code was used in the comparison table and throughout the rest of the article: green for high performance, orange for fair, and red for poor.
How we Measure Performances
All performance measures provided throughout this article, including access times, throughput and wear distributions, are measured using NOR and NAND flash simulation unless stated otherwise. The main reason why we use simulation over real flash is because we can perform very large amounts of accesses in a reasonable amount of time and thus, observe the evolution of file systems behaviour on long time spans. This is important for evaluating wear-levelling, but also write performances in general, as it can take a while for garbage collection to settle in and file systems to reach their steady-state performance level.
| Parameter | NOR flash | NAND flash |
|---|---|---|
| Device Size (MiB) | 16 | 128 |
| Block Size (KiB) | 64 | 128 |
| Page Size (bytes) | 256 | 2048 |
| Page Load time (us) | 0 | 100 |
| Page Program Time (us) | 120 | 300 |
| Block Erase Time (ms) | 150 | 3 |
| Bus throughput (MB/s) | 40 | 40 |
The simulation does not include other system-level limiting factors, such as CPU or RAM access overhead. Those have no or limited impact on write performances, but the effect can be more significant for small read accesses, something to keep in mind when interpreting read benchmarks.
Fail-Safety
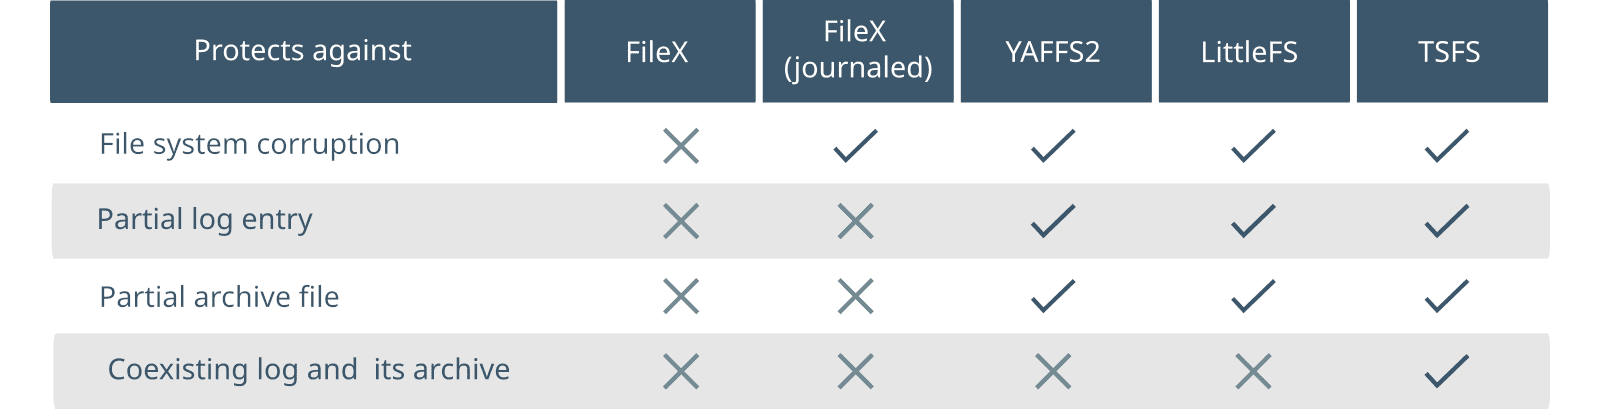
LittleFS, Yaffs, FileX and TSFS are all fail-safe, in the sense that neither of them can be corrupted by a power failure or other untimely interruption. This is not to say, however, that they provide the same guarantees. To illustrate some of the differences, consider a hypothetical application where log files are filled, one entry at a time, and then archived upon reaching a maximum size. To make things interesting, suppose that a log entry is large enough that it cannot fit in RAM. Instead, each entry is stored through successive, smaller write accesses, as data comes in from, say, sensors or some communication link. When a full log is archived, the original log is deleted. The oldest archive is also deleted to keep the number of archives under a desired maximum. Figure 2 shows the various integrity and consistency guarantees provided by each file system in this hypothetical scenario.
FileX provides fail safety through journalling. Each update is recorded in advance into a dedicated intent log (or journal) before the file system is actually modified. FileX identifies interrupted operations from the journal, and either completes or rolls back partial modifications upon recovery, ensuring that the file system always returns to a consistent state. FileX provides atomic file-level operations, which is unlike other journalled FAT implementations.
LittleFS, Yaffs and TSFS all leverage copy-on-write (required for native flash support) to extend atomicity to arbitrarily long, application-delimited sequences of file updates (as opposed to a single update for FileX). In the case of LittleFS and Yaffs, file modifications are not effective until the updated file is either closed or synchronized (at the application request). When that happens, the file system atomically switches to the new, modified state, leaving no room for partial modifications. TSFS pushes this all-or-nothing behaviour a bit further, with transactions. Transactions are atomic update sequences containing any number of modifications to any number of files or directories (including file update, creation, deletion, renaming, truncation, etc.). This is explained in greater detail in our article Fail-Safe Storage with TSFS.
Memory Allocation and RAM Usage
| TSFS | Yaffs | FileX | LittleFS |
|---|---|---|---|
| Memory allocated upon instance creation on a user-provided memory segment. No memory allocation beyond instance creation. | Memory allocated at runtime using free/alloc functions defined in the port. | Memory allocated upon instance creation on a user-provided memory segment. No memory allocation beyond instance creation. | Objects and buffers allocated by the user and passed on to the file system on each API call. |
Figure 3 and Figure 4 show RAM requirements for each file system, on NOR flash and NAND flash respectively. The indicated RAM usage ranges from the minimal absolute configuration, up to a maximum performance configuration beyond which only marginal gains can be realized.
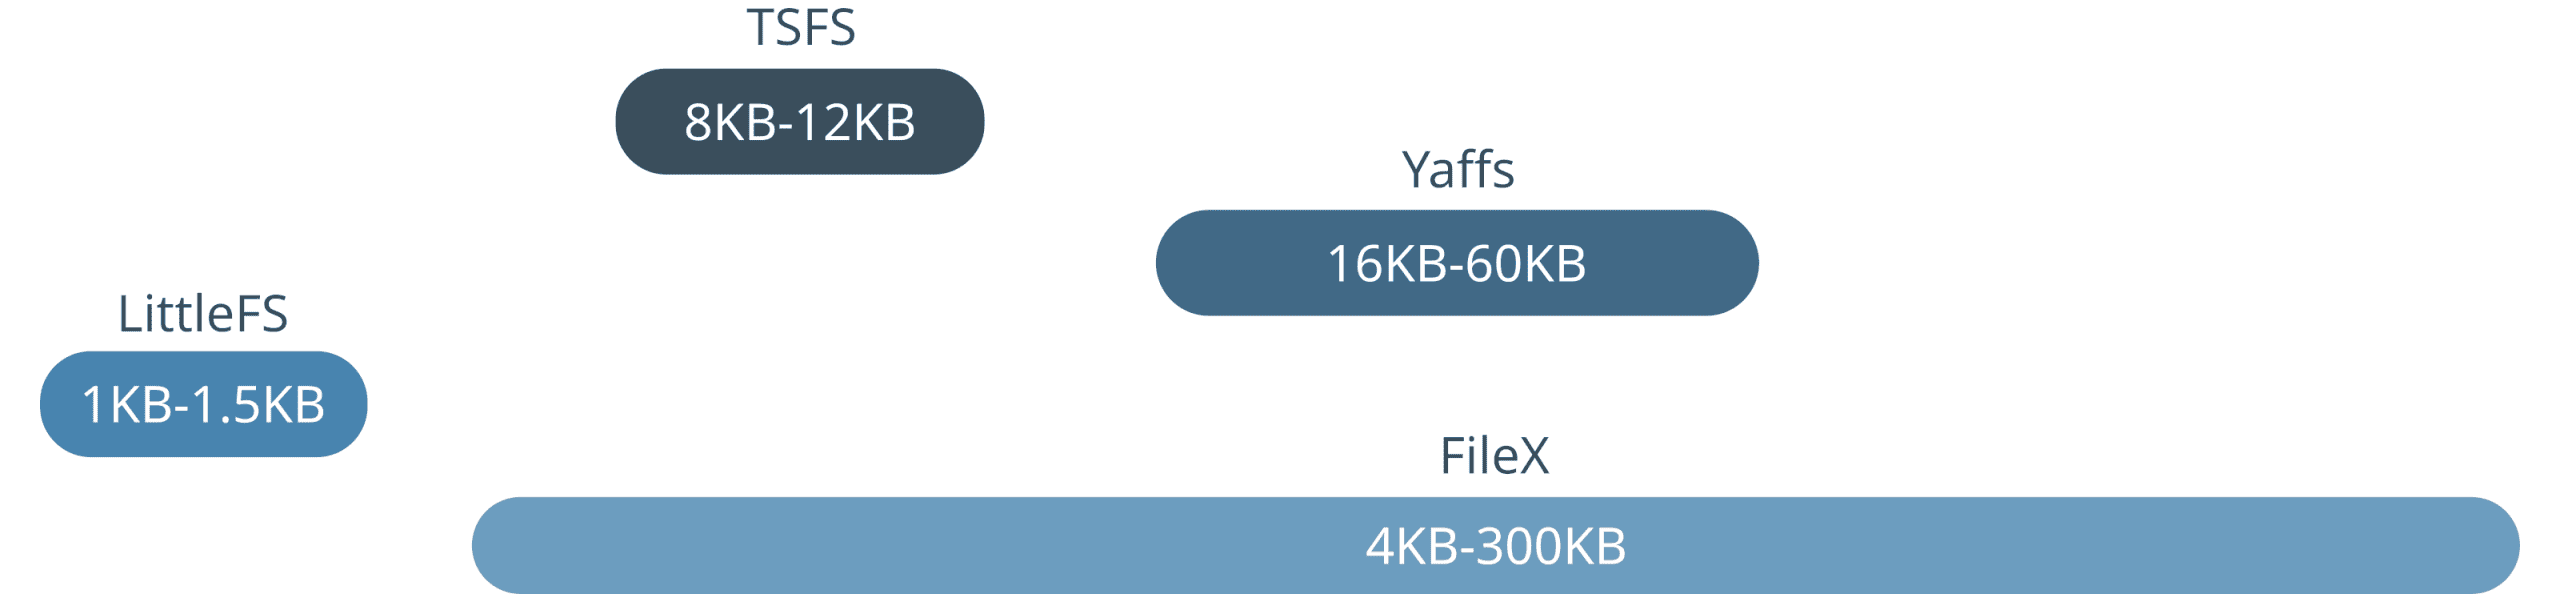
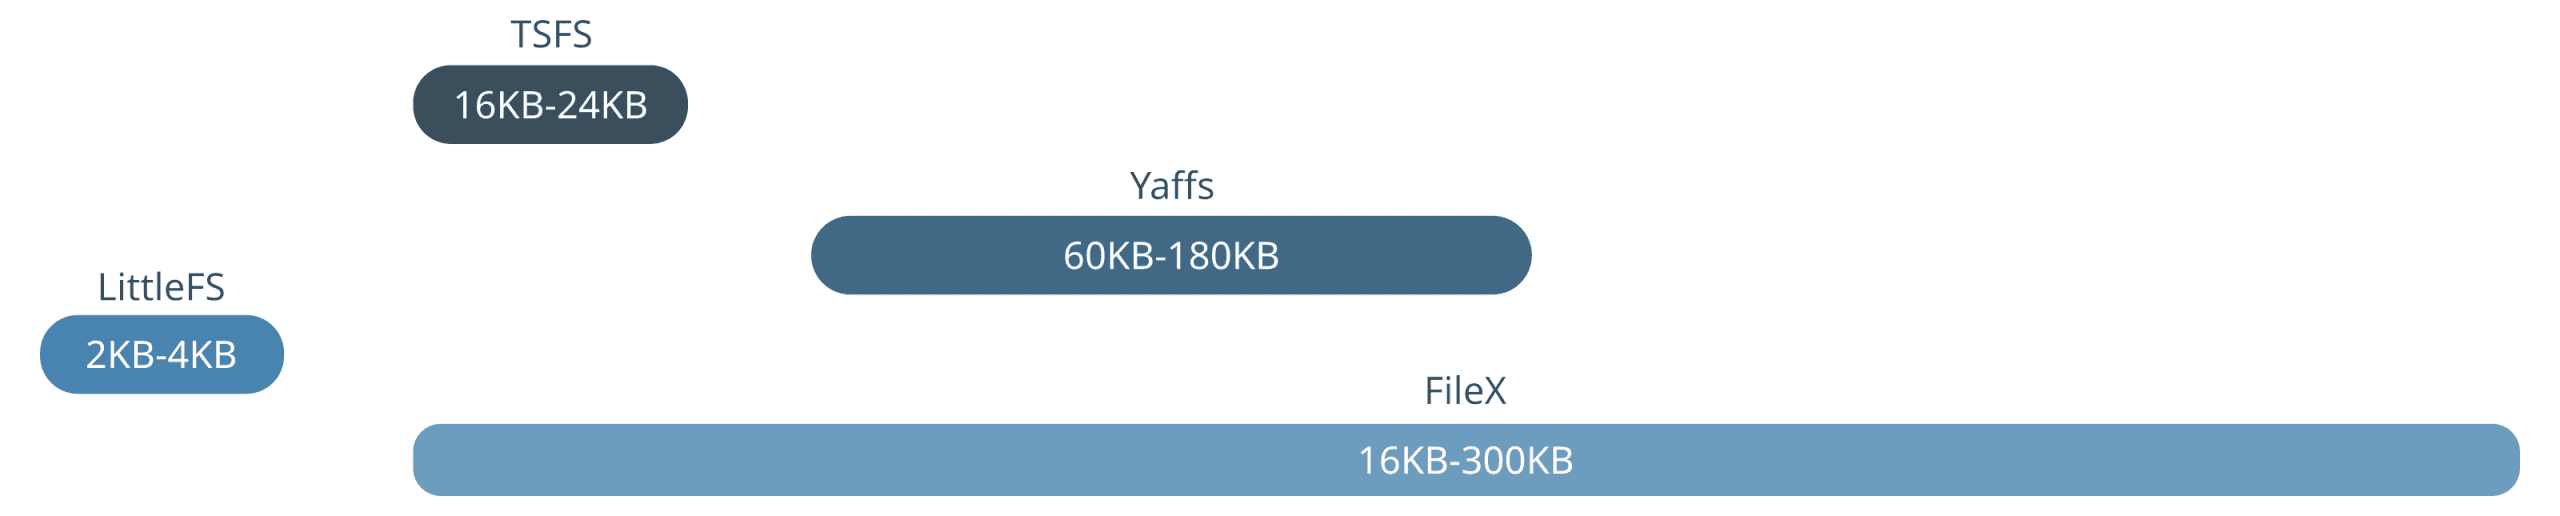
Focusing first on the minimum RAM requirement, LittleFS stands out as the less demanding, followed by FileX and TSFS. Yaffs has by far the highest minimum RAM requirement of the bunch which is expected given that indexing structures and various other metadata is entirely kept in RAM.
LittleFS and TSFS both provide a near-constant level of performance, regardless of the configuration. In the case of LittleFS, read performances are excellent with no caching at all, while write performances are poor for fundamental design reasons that we will discuss later on. TSFS, on the other hand, offers very high performances across the board, with only a slight improvement in random read performances as more RAM is added.
Yaffs allows for some trade-off between performance and RAM usage through the chunk (sector) size configuration. A lower chunk size comes with a higher RAM usage but provides improved performances for small accesses. Conversely, a higher chunk size decreases the RAM usage, but increases write amplification for smaller access sizes. For reference, a 4KiB sector size configuration for a 16MiB NOR requires around 16KB of RAM, while a 1KiB sector size configuration requires around 50KB. All Yaffs benchmarks presented in this article were run with a chunk size matching the access size, except for accesses smaller than 1KiB since the minimum supported chunk size is 1KiB.
FileX RAM usage calculation is trickier. Performances largely depend on the size of the internal FAT entry cache, especially for random accesses. On NOR flash (and other small devices), large clusters can be used to minimize the size of the FAT table and the amount of cache needed to absorb most of the costly cluster chain lookups. Also, FileX implements a FAT table cache which size can be adjusted at compile-time through the FX_MAX_FAT_CACHE configuration. When journalling is switched on, however, a large cluster size comes with increased write amplification (because clusters are copied upon modification), so there is a trade-off there. Also, in the case of NOR, the FTL generates a lot of extra read accesses as part of garbage collection. Those extra read accesses can be absorbed with additional caching RAM which can be adjusted at compile-time through the LX_NOR_SECTOR_MAPPING_CACHE_SIZE configuration. For the best possible performances, up to a few hundred kilobytes of RAM might be needed, depending on the access size, the access pattern and the size of the working set. All FileX/LevelX benchmarks presented in this article were run with both FX_MAX_FAT_CACHE and LX_NOR_SECTOR_MAPPING_CACHE_SIZE set to 1024.
Write Throughput and Maximum Write Time versus Access Size
Overall write performances are largely determined by how much is written at once. In general, smaller accesses produce lower performances. How much lower depends on the combination of storage devices and file system. In this section, we measure the average write throughput and maximum write access time for various access sizes. Both random and sequential write workloads are tested on NOR and NAND flash.
Method
Accesses are performed on a single test file of half the size of the simulated device, that is an 8MiB file on NOR and 64MiB on NAND.
In the sequential access case, the access position is increased until the end of the file is reached, at which point the position is reset and existing content is overwritten. In the random access case, the access position is uniformly distributed across the entire file.
In all cases, the test file is filled using sequential accesses beforehand. Each access is completed, down to the storage device, before the next access begins. In the case of Yaffs and LittleFS, this means opening and closing the test file before and after each access. In the case of TSFS, we must also call the tsfs_commit() function after each access.
Results and Discussion
Table 3 and Table 4 show average sequential write throughputs and maximum access times obtained on NOR and NAND flash, for each file system and for various access sizes. Table 5 and Table 6 show corresponding results for random accesses.
| NOR (KB/s) | NAND (KB/s) | ||||||||
|---|---|---|---|---|---|---|---|---|---|
| 256 | 512 | 1024 | 2048 | 4096 | 1024 | 2048 | 4096 | 8192 | |
| TSFS | 168 | 228 | 273 | 296 | 301 | 355 | 2339 | 3146 | 3797 |
| Yaffs | 21 | 42 | 113 | 116 | 223 | 463 | 1350 | 2996 | 3762 |
| Filex w/o journal | 36 | 83 | 170 | 226 | 272 | 9 | 18 | 26 | 35 |
| Filex w/ journal | 19 | 43 | 12 | 28 | 104 | 6 | 11 | 10 | 20 |
| LittleFS | <1 | <1 | <1 | <1 | <1 | <1 | <1 | <1 | 1 |
| LittleFS (append) | <1 | <1 | 1 | 1 | 21 | 2 | 4 | 5 | 5 |
| NOR (ms) | NAND (ms) | ||||||||
|---|---|---|---|---|---|---|---|---|---|
| 256 | 512 | 1024 | 2048 | 4096 | 1024 | 2048 | 4096 | 8192 | |
| TSFS | 152 | 151 | 153 | 153 | 155 | 7 | 5 | 5 | 9 |
| Yaffs | 157 | 157 | 157 | 175 | 155 | 9 | 9 | 27 | 7 |
| Filex w/o journal | 178 | 183 | 175 | 182 | 187 | 419 | 326 | 441 | 479 |
| Filex w/ journal | 180 | 179 | 239 | 239 | 211 | 663 | 509 | 1621 | 1406 |
| LittleFS | 21565 | 21185 | 22001 | 22423 | 22777 | 21327 | 22749 | 22787 | 22157 |
| LittleFS (append) | 16068 | 16251 | 15733 | 15974 | 718 | 1260 | 1260 | 1970 | 3419 |
| NOR (KB/s) | NAND (KB/s) | ||||||||
|---|---|---|---|---|---|---|---|---|---|
| 256 | 512 | 1024 | 2048 | 4096 | 1024 | 2048 | 4096 | 8192 | |
| TSFS | 82 | 129 | 173 | 202 | 217 | 500 | 1715 | 2252 | 2598 |
| Yaffs | 26 | 51 | 103 | 115 | 161 | 539 | 1172 | 1772 | 2350 |
| Filex w/o journal | 26 | 52 | 90 | 140 | 195 | 9 | 18 | 26 | 35 |
| Filex w/ journal | 17 | 34 | 127 | 25 | 51 | 6 | 11 | 8 | 17 |
| LittleFS | <1 | <1 | <1 | <1 | <1 | <1 | <1 | <1 | 1 |
| NOR (ms) | NAND (ms) | ||||||||
|---|---|---|---|---|---|---|---|---|---|
| 256 | 512 | 1024 | 2048 | 4096 | 1024 | 2048 | 4096 | 8192 | |
| TSFS | 152 | 151 | 152 | 153 | 156 | 8 | 5 | 6 | 10 |
| Yaffs | 157 | 157 | 157 | 167 | 461 | 9 | 9 | 12 | 18 |
| Filex w/o journal | 178 | 176 | 180 | 178 | 176 | 276 | 231 | 403 | 406 |
| Filex w/ journal | 182 | 179 | 246 | 239 | 234 | 588 | 557 | 1907 | 1768 |
| LittleFS | 21676 | 21717 | 21725 | 22073 | 22843 | 21832 | 21991 | 22151 | 21456 |
In all scenarios, LittleFS stands out with extremely poor write performances, consistent across workloads and flash technologies. Notice in particular how high is the maximum access time in all configurations. Also, our random benchmark initially failed with the LFS_ERR_NOSPC error code (no space available). There are two main reasons behind the low performances and the file size limitation:
- When appending data, the content of the last block in that file must be copied over to a new block. Each new update therefore triggers a block erase which makes for a very low write throughput and considerably shortens the device lifetime (see a description of this issue here).
- When writing to some arbitrary location within a file, any content located after the update must be rewritten to maintain the backward linked list attaching the file blocks, as described in the LittleFS documentation. Not only does this take time and dramatically increase write amplification, it also means that enough room must be available for the modified file to be copied over, hence our test failing with a file taking up slightly more than 50% of the available space. This issue could be mitigated, at least to some degree, by spreading the entire data across a larger number of smaller files.
Using a slightly smaller file (i.e. 45% of the device size), the LittleFS random write benchmark completed without errors. Also, by modifying our benchmark such that data is always appended at the end of the test file (as opposed to overwriting existing data) performances slightly. Results presented in the last row of Table 3 and Table 4 (LittleFS) were obtained using the modified benchmark.
In the case of FileX/LevelX, performances are generally acceptable on NOR flash, but poor on NAND flash. In general, performances are limited by a few different factors:
- Journalling comes with additional write accesses to the journal: before the actual file update, to log the operation to come, and once the update is completed, to reset the journal. These accesses must be strictly ordered which makes write-back caching useless. As a matter of fact, enabling the fault tolerant mode in FileX causes a significant drop in write throughput.
- With fault tolerant mode enabled, FileX uses out-of-place cluster updates. Even if only partially updated, a cluster must be entierely copied over to a new location, increasing write amplification and reducing write performances.
- FileX has a \({O}(n)\) lookup time complexity (\(n\) being the number of clusters), consistent with other FAT implementations. LevelX for NOR has a \({O}(k)\) lookup time complexity (where k is the number of sectors). Combined with FileX, we are looking at a \(\mathcal{O}(n^2)\) time complexity (neglecting the constant cluster/sector ratio) which can seriously hamper random access performances, especially in the presence of fragmentation, and especially on memory-constrained platforms with modest amounts of caching RAM available. LevelX for NAND keeps the entire block mapping in RAM so the lookup time is less of an issue.
- LevelX for NAND aggressively consolidates consecutive logical sectors into physically consecutive flash pages. In other words, most of the time, when a sector is updated or released, other sectors within the same physical block are copied over to a new block. This drives write amplification up and overall write performances down.
In the case of YAFFS, high write performances were expected since YAFFS keeps entire indexing structures in RAM. Looking at benchmark results, we can see that overall write performances are indeed excellent. On NOR flash though, YAFFS is significantly slower than TSFS, especially when it comes to smaller accesses. There are two main reasons for this:
- YAFFS must write one extra chunk upon closing or synchronizing a file to mark the end of an atomic file update. For a single-chunk write, the write throughput is thus cut in half. On the other hand, the TSFS commit overhead is typically around 50 bytes on NOR flash.
- YAFFS2 does not support chunks smaller than 1KiB, so smaller updates will always result in a read-modify-write sequence which further decreases the write throughput. TSFS, on the other hand, supports 256-byte sectors which helps with small access performances.
In the case of TSFS, the main limiting factor when it comes to average write throughput is the metadata update overhead. This is why write performances decline as the access size gets smaller. Overall, though, TSFS offers very high throughput and low access times across workloads and flash technologies.
Write Throughput versus Working Set Size
On raw flash, the average write throughput for random-like accesses decreases as the amount of stored data increases. A similar relation exists in the case of small sequential accesses (i.e., smaller than the smallest physical access unit). This relation between the average write throughput and the amount of free storage space is a consequence of garbage collection, a fundamental requirement of all flash file systems (see our article Making Sense of Flash File System Performances for more details). A high-performance flash file system should take advantage of the available free space to maximize write performances, leaving it to the application designer to balance space and performance to meet their requirements.
Method
We show how file systems behave under random workloads by performing 4KiB write accesses at random, uniformly distributed, positions across a single file occupying a varying proportion (from 12% to 75%) of the available storage space. We also show how file systems behave under small sequential access workloads, by performing 512-byte accesses on a NAND with 2KiB pages. In both cases, the test file is filled using sequential accesses before each test, and each access is completed, down to the storage device, before the next access begins.
Results and Discussion
Figure 5 shows the random write throughput on NOR flash for each file system and various working set sizes (expressed as a percentage of the flash size). Figure 6 shows the corresponding results for NAND flash. In both figures, the orange line represents an upper bound. How we determine this upper bound is explained in our article Making Sense of Flash File System Performances.
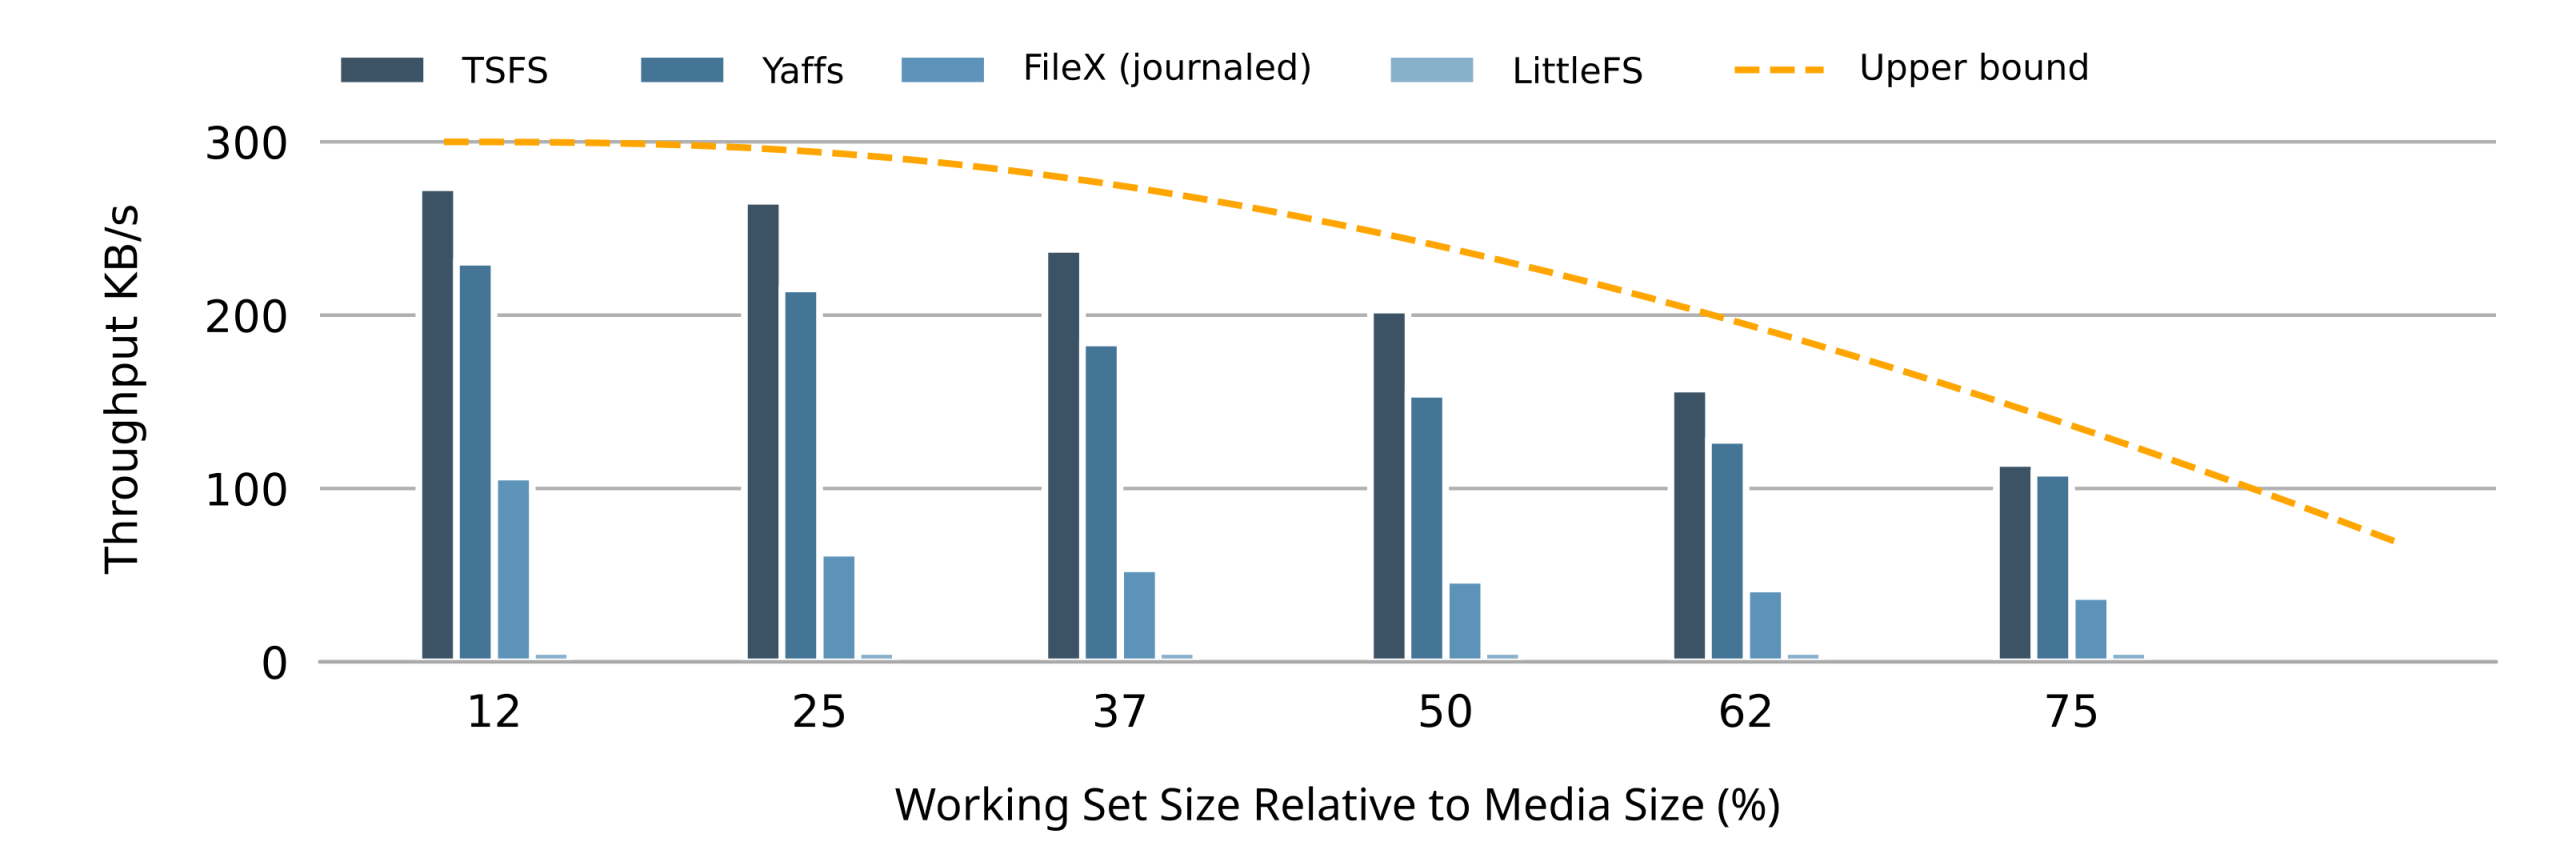
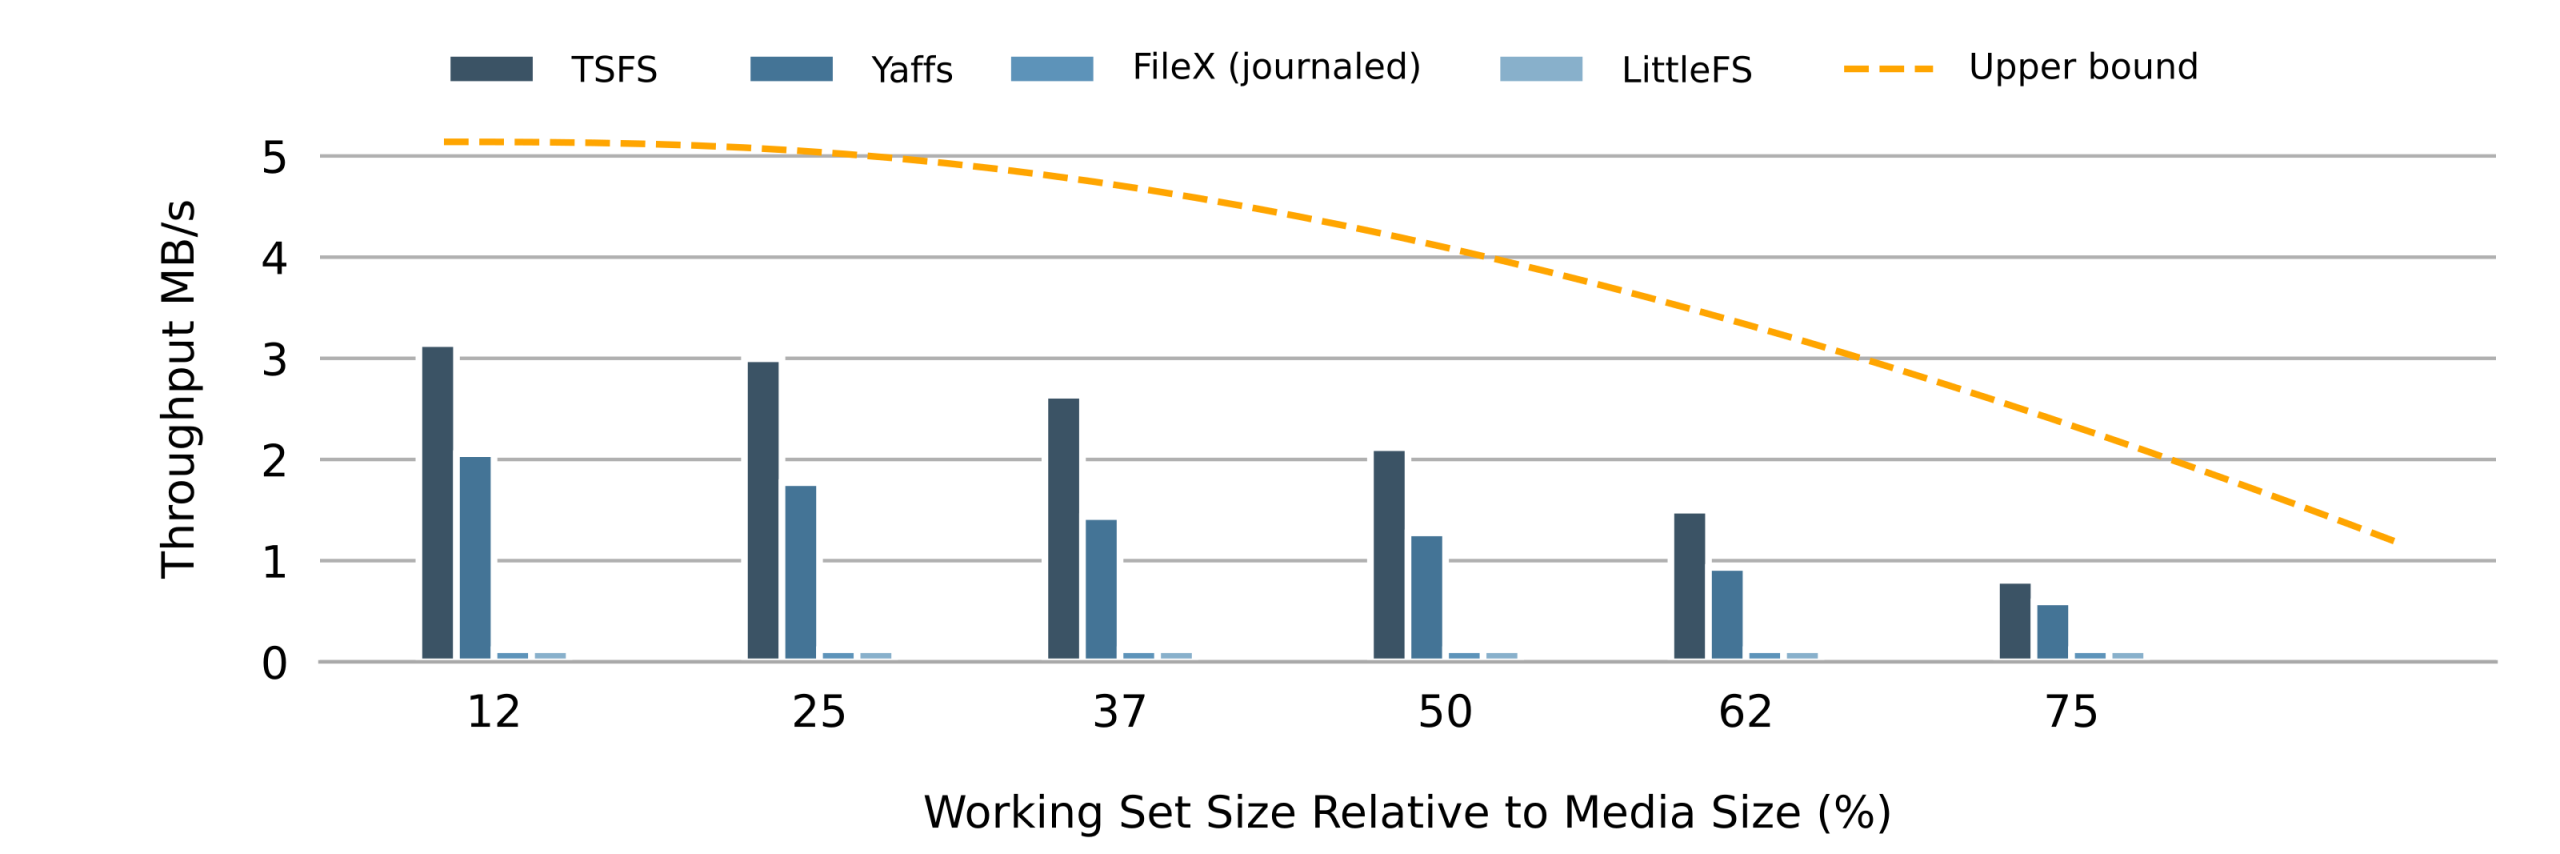
The first thing that catches the eye when looking at figure 5 and figure 6 is how the average write throughput drops as the size of the working set increases, regardless of the file system or storage device, and in line with our expectations.
Looking more closely, we can see how both Yaffs and TSFS average write throughputs follow the optimal curve. Measured throughputs follow the optimal curve more closely on NOR flash because the committing overhead (TSFS) and object header update overhead (Yaffs) is smaller on NOR. Also, because TSFS committing is very efficient, its overall performances are slightly higher regardless of the working set size.
FileX/LevelX performances are much lower, especially on NAND. Decreasing the size of the working set only slightly improves random write performances on NOR, while the write throughput remains consistently low on NAND flash. Unsurprisingly, LittleFS exhibits poor random write performances regardless or the working set size on both NOR and NAND flash.
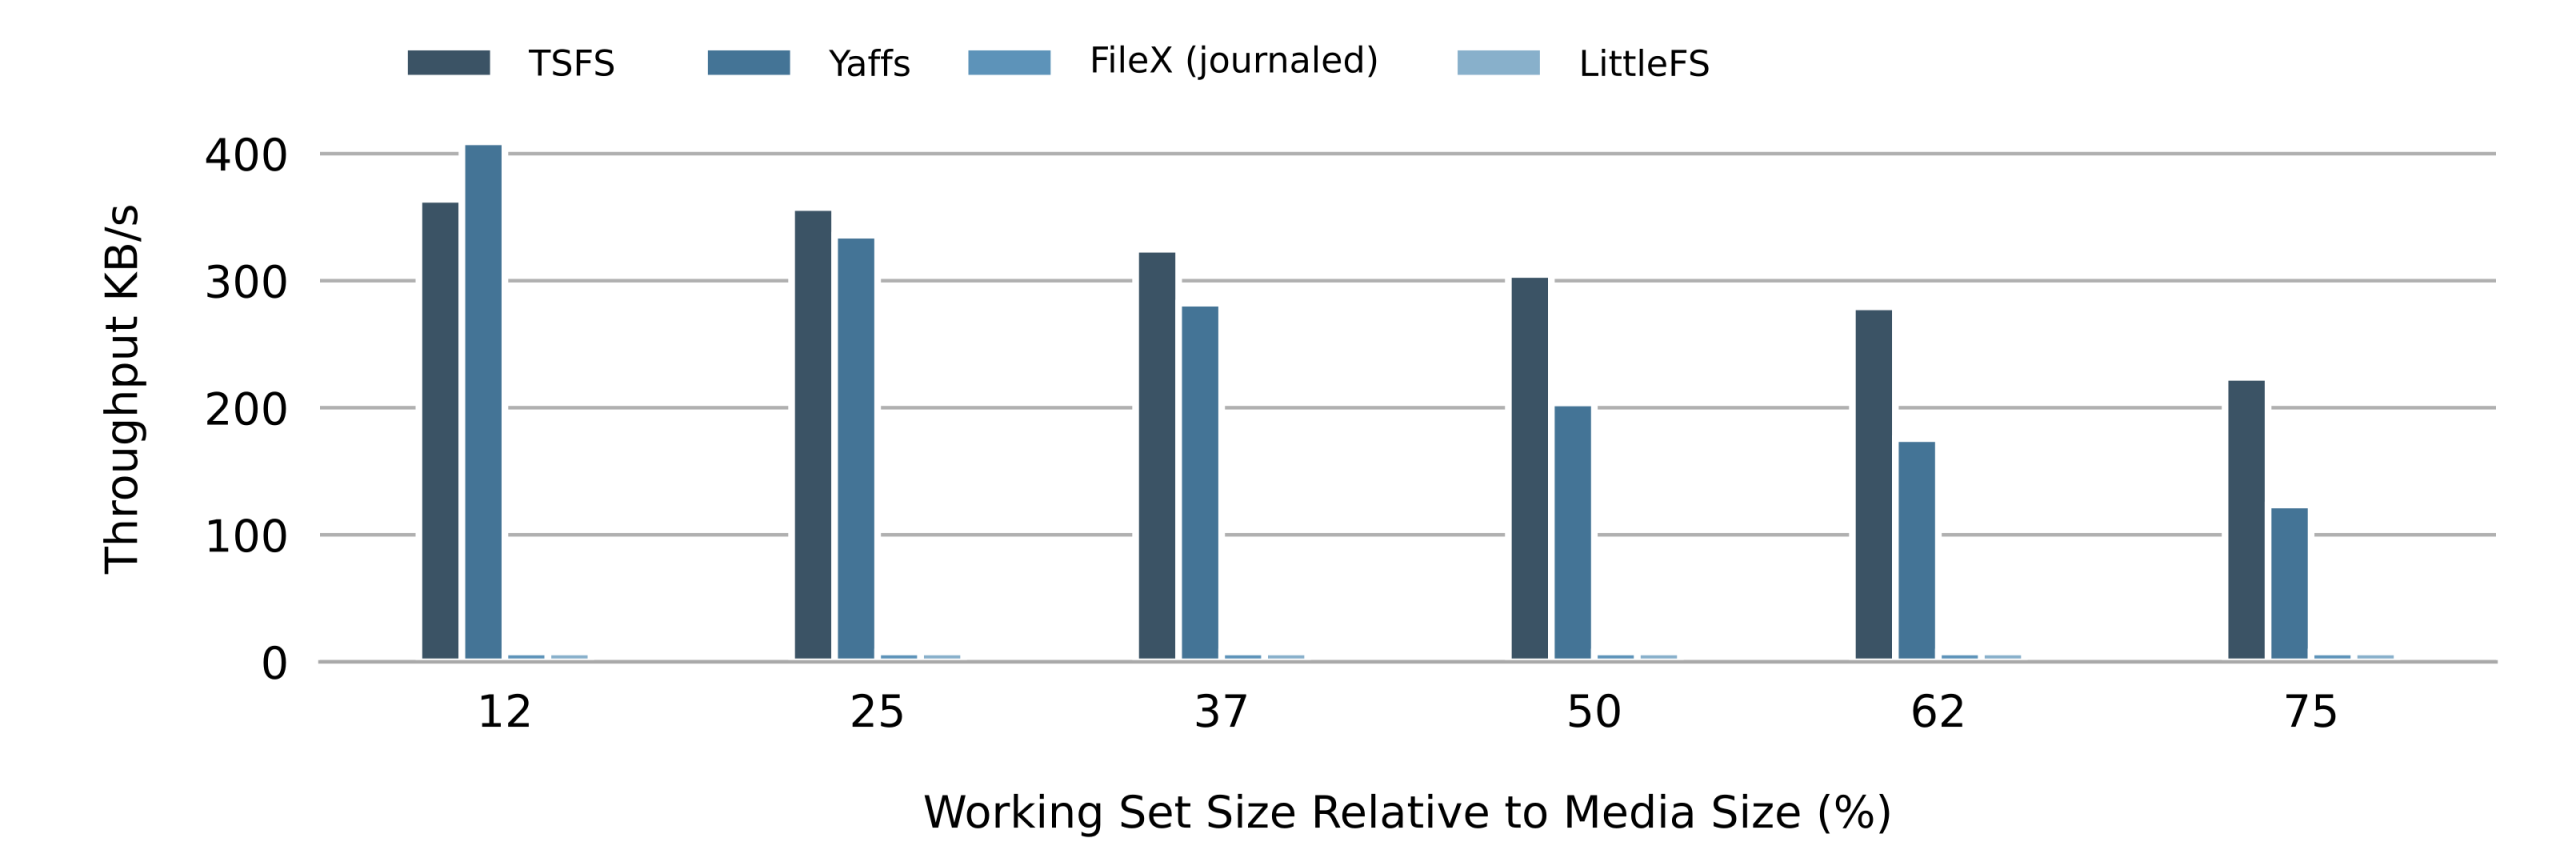
Figure 7 shows how the write throughput for small (512-byte) accesses decreases as the size of the working set increases. This is similar to what we observed for random access, althoug in this case, the average throughput is significantly lower since each 512-byte access requires at least a 2KiB page update, therefore imposing a minimum write amplification of 2048 / 512 = 4.
Write Amplification and Wear Distribution (Wear Leveling)
Wear levelling is a cornerstone of flash management. It ensures that some flash blocks are not erased more often than others, which could lead to premature block failure and eventually file system failure when the number of bad blocks grows too high. Perfect wear-levelling produces perfectly flat wear distributions, with the same amount of erasing performed on each block. But wear-levelling only guarantees equal wear distribution: it does not prevent excessive erasing. This is where the notion of write amplification comes in. The write amplification is a measure of how much more writing (and thus erasing) is performed by a file system (or data storage software in general) for a given amount of stored data. An ideal file system has a write amplification of one. Of course no such file system exists: real file systems always have some level of write amplification due to garbage collection and on-disk structure updates.
Method
To measure the wear distribution and write amplification, we create two files. Both files have the same size which is one fourth of the media size. Also, both files are alternately filled using 4KiB sequential accesses, starting over from position 0 when the end of the file is reached. The test completes when the total amount of written data exceeds 512 times the size of the media. In order to put wear-levelling capabilities to the test, write accesses are split across the test files such that one file is written 128 times as much as the other file, in total. How much data is written to one file before the other file is written (back and forth) is randomly determined at runtime.
Results and Discussion
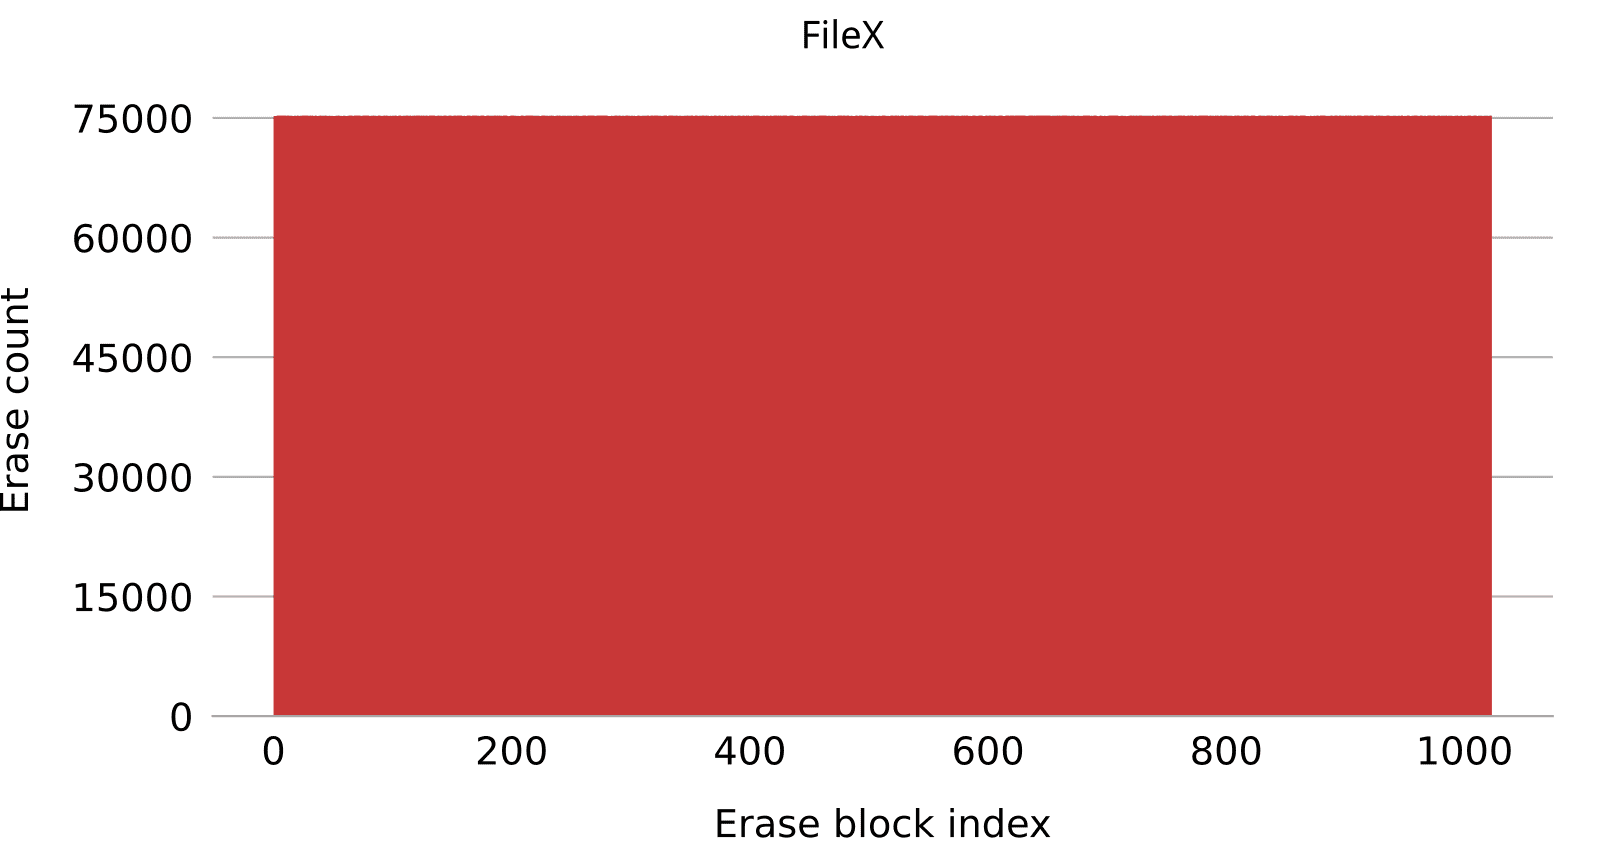
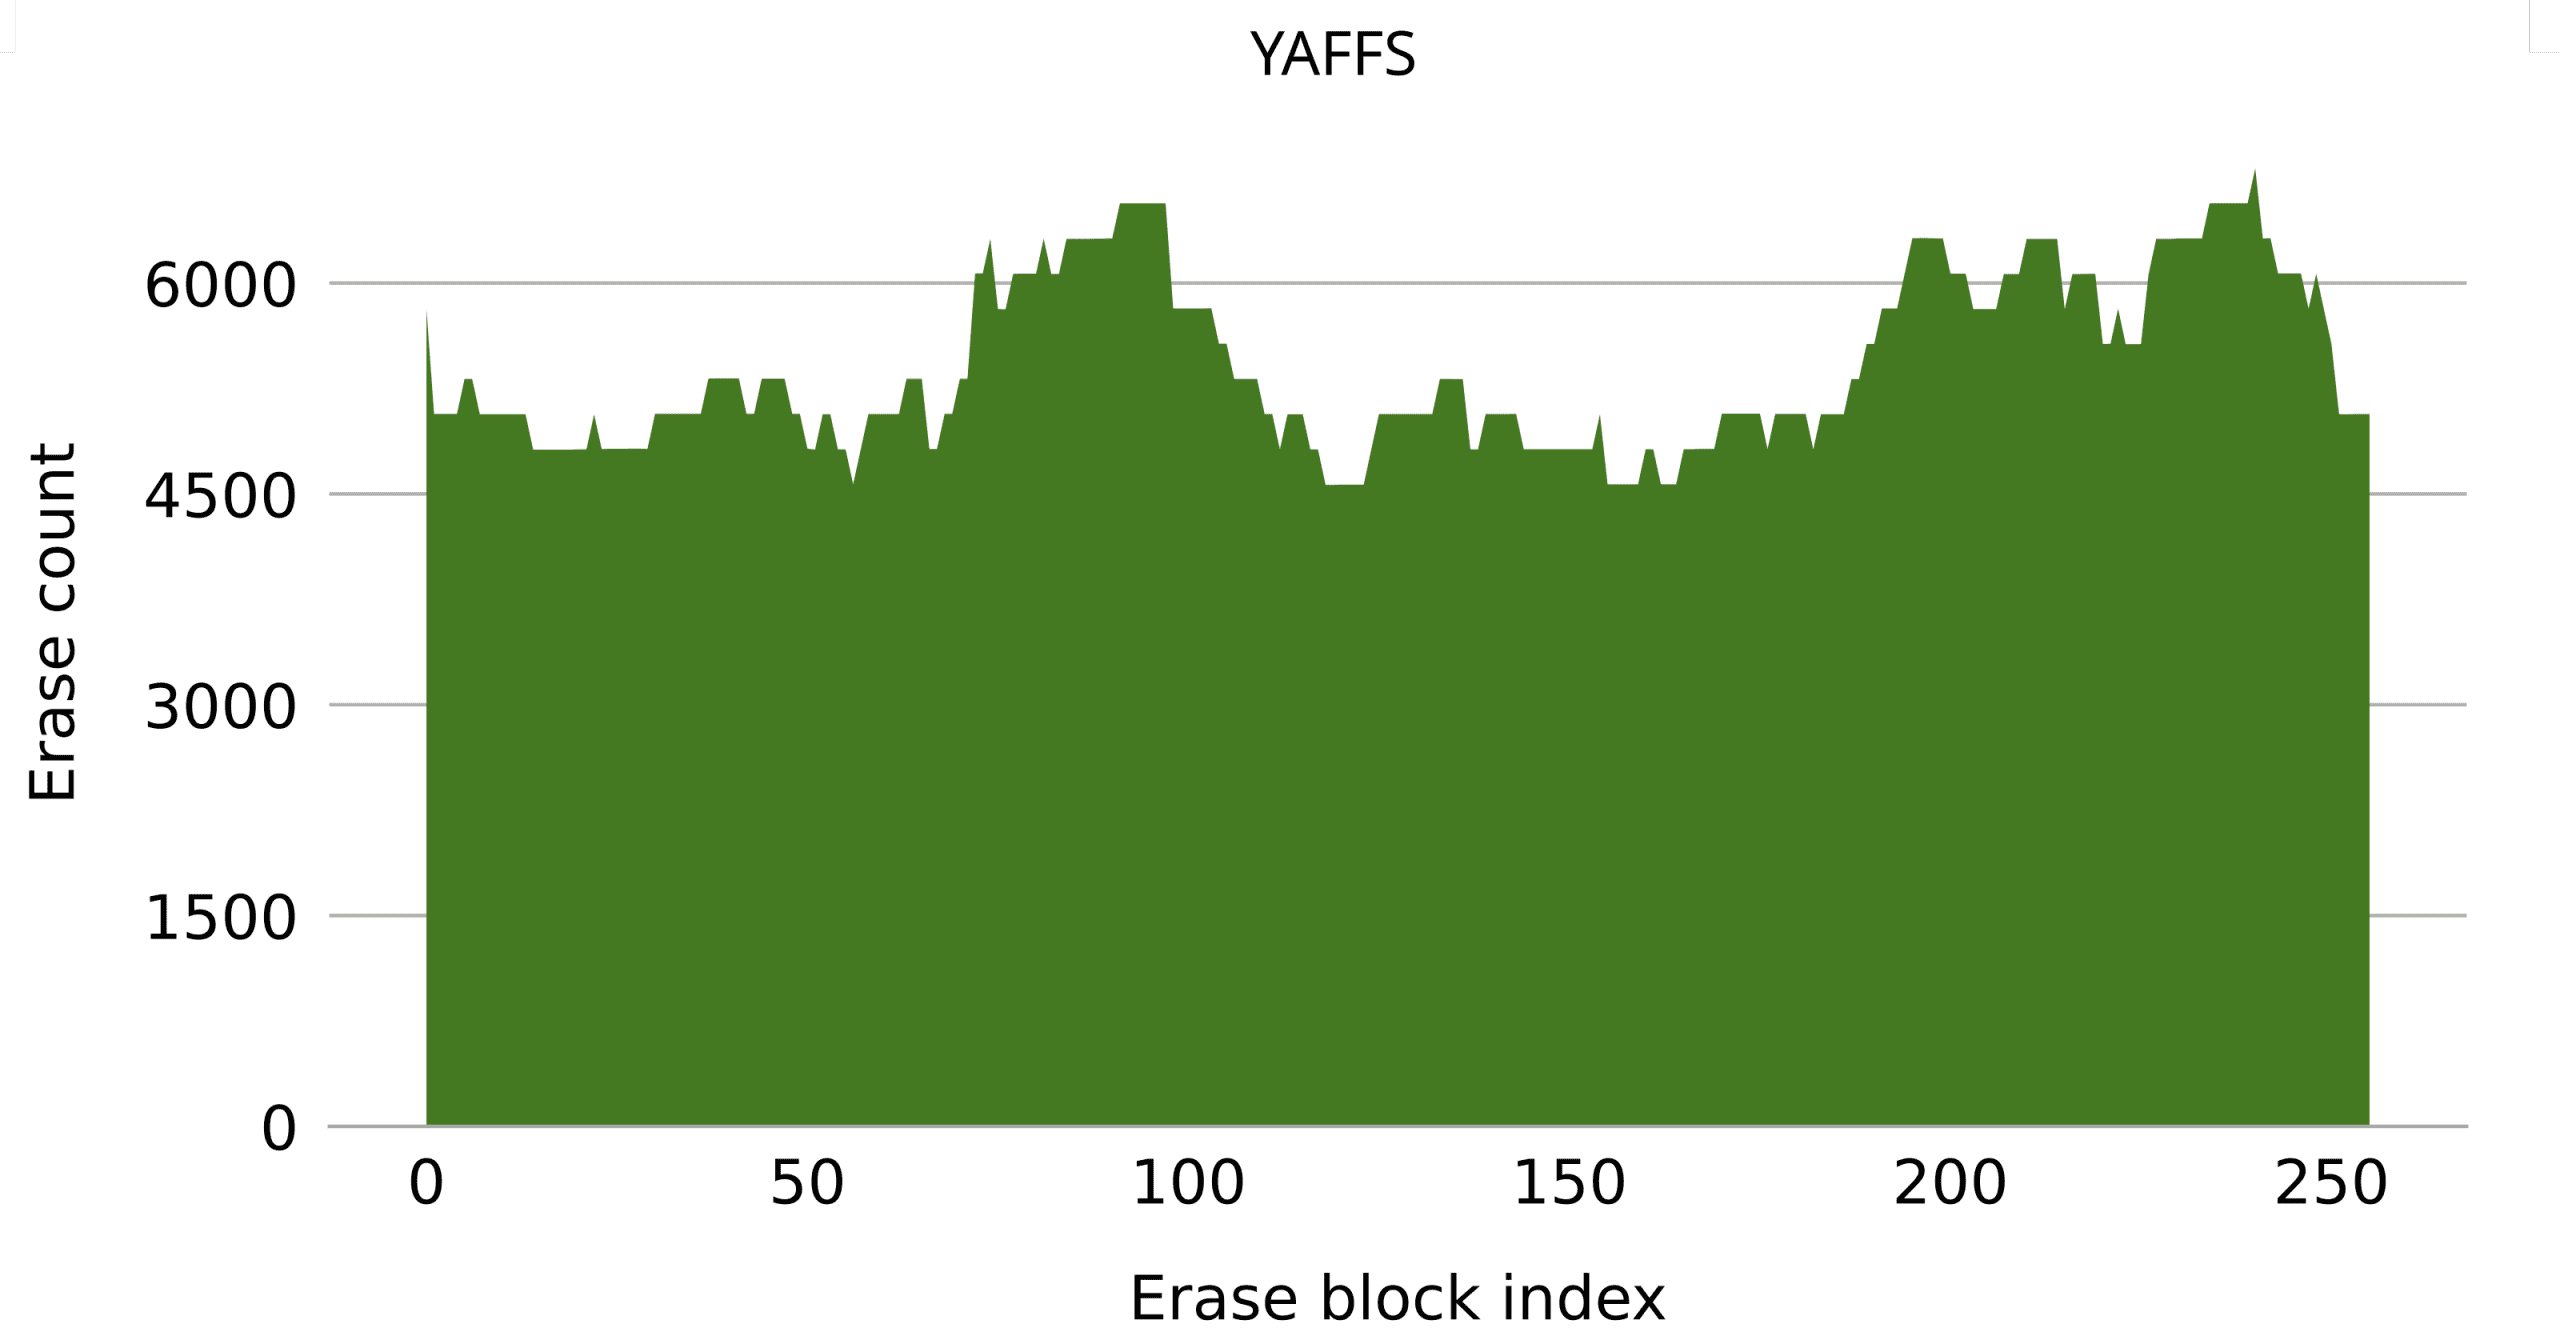
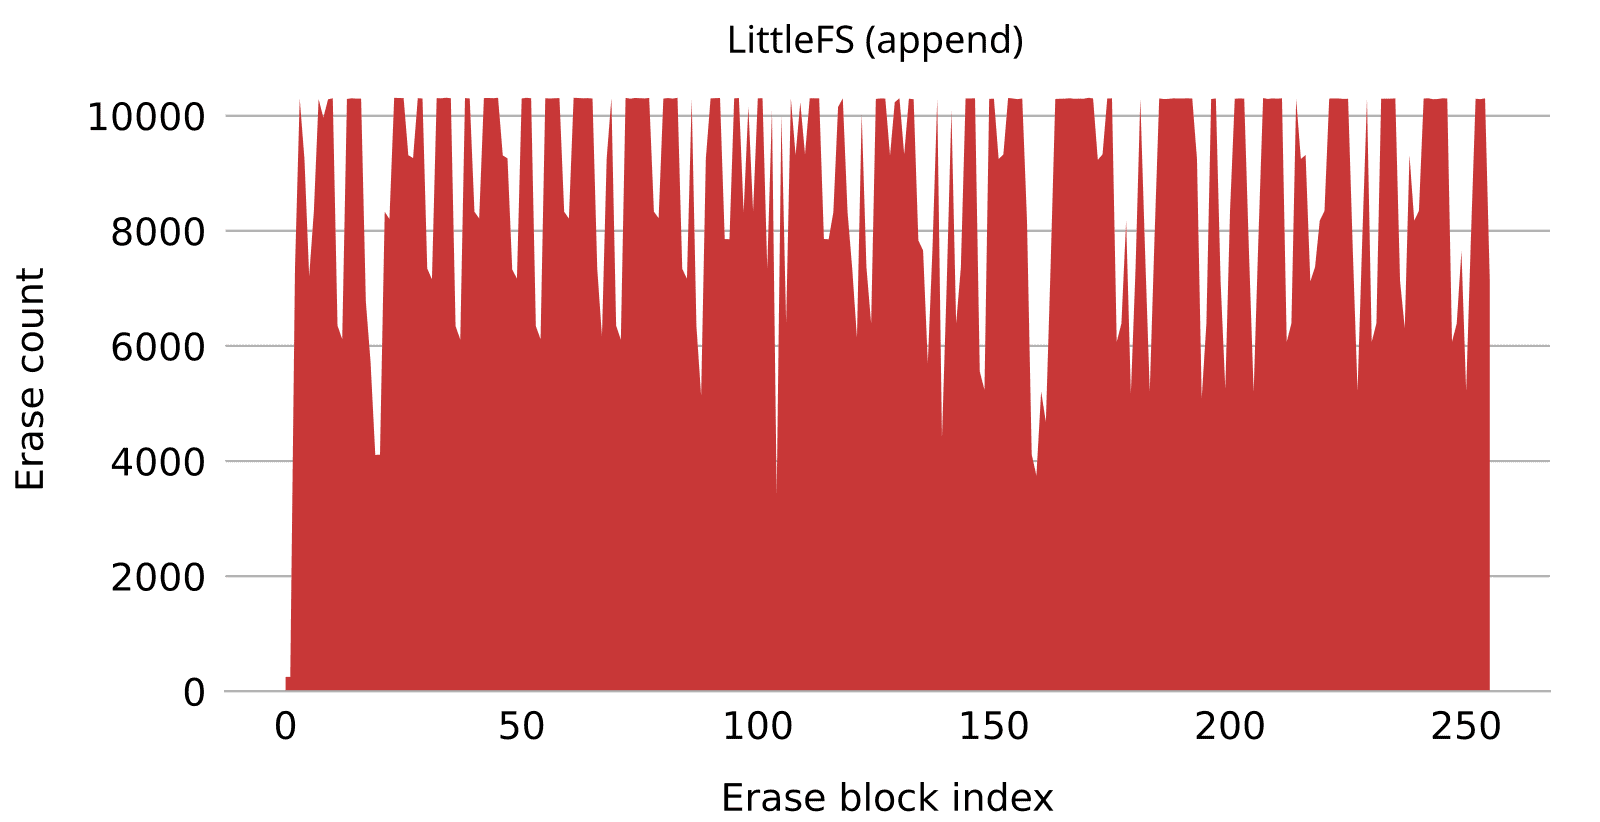
Figure 8 shows the wear distribution for all four tested file systems on NOR flash.
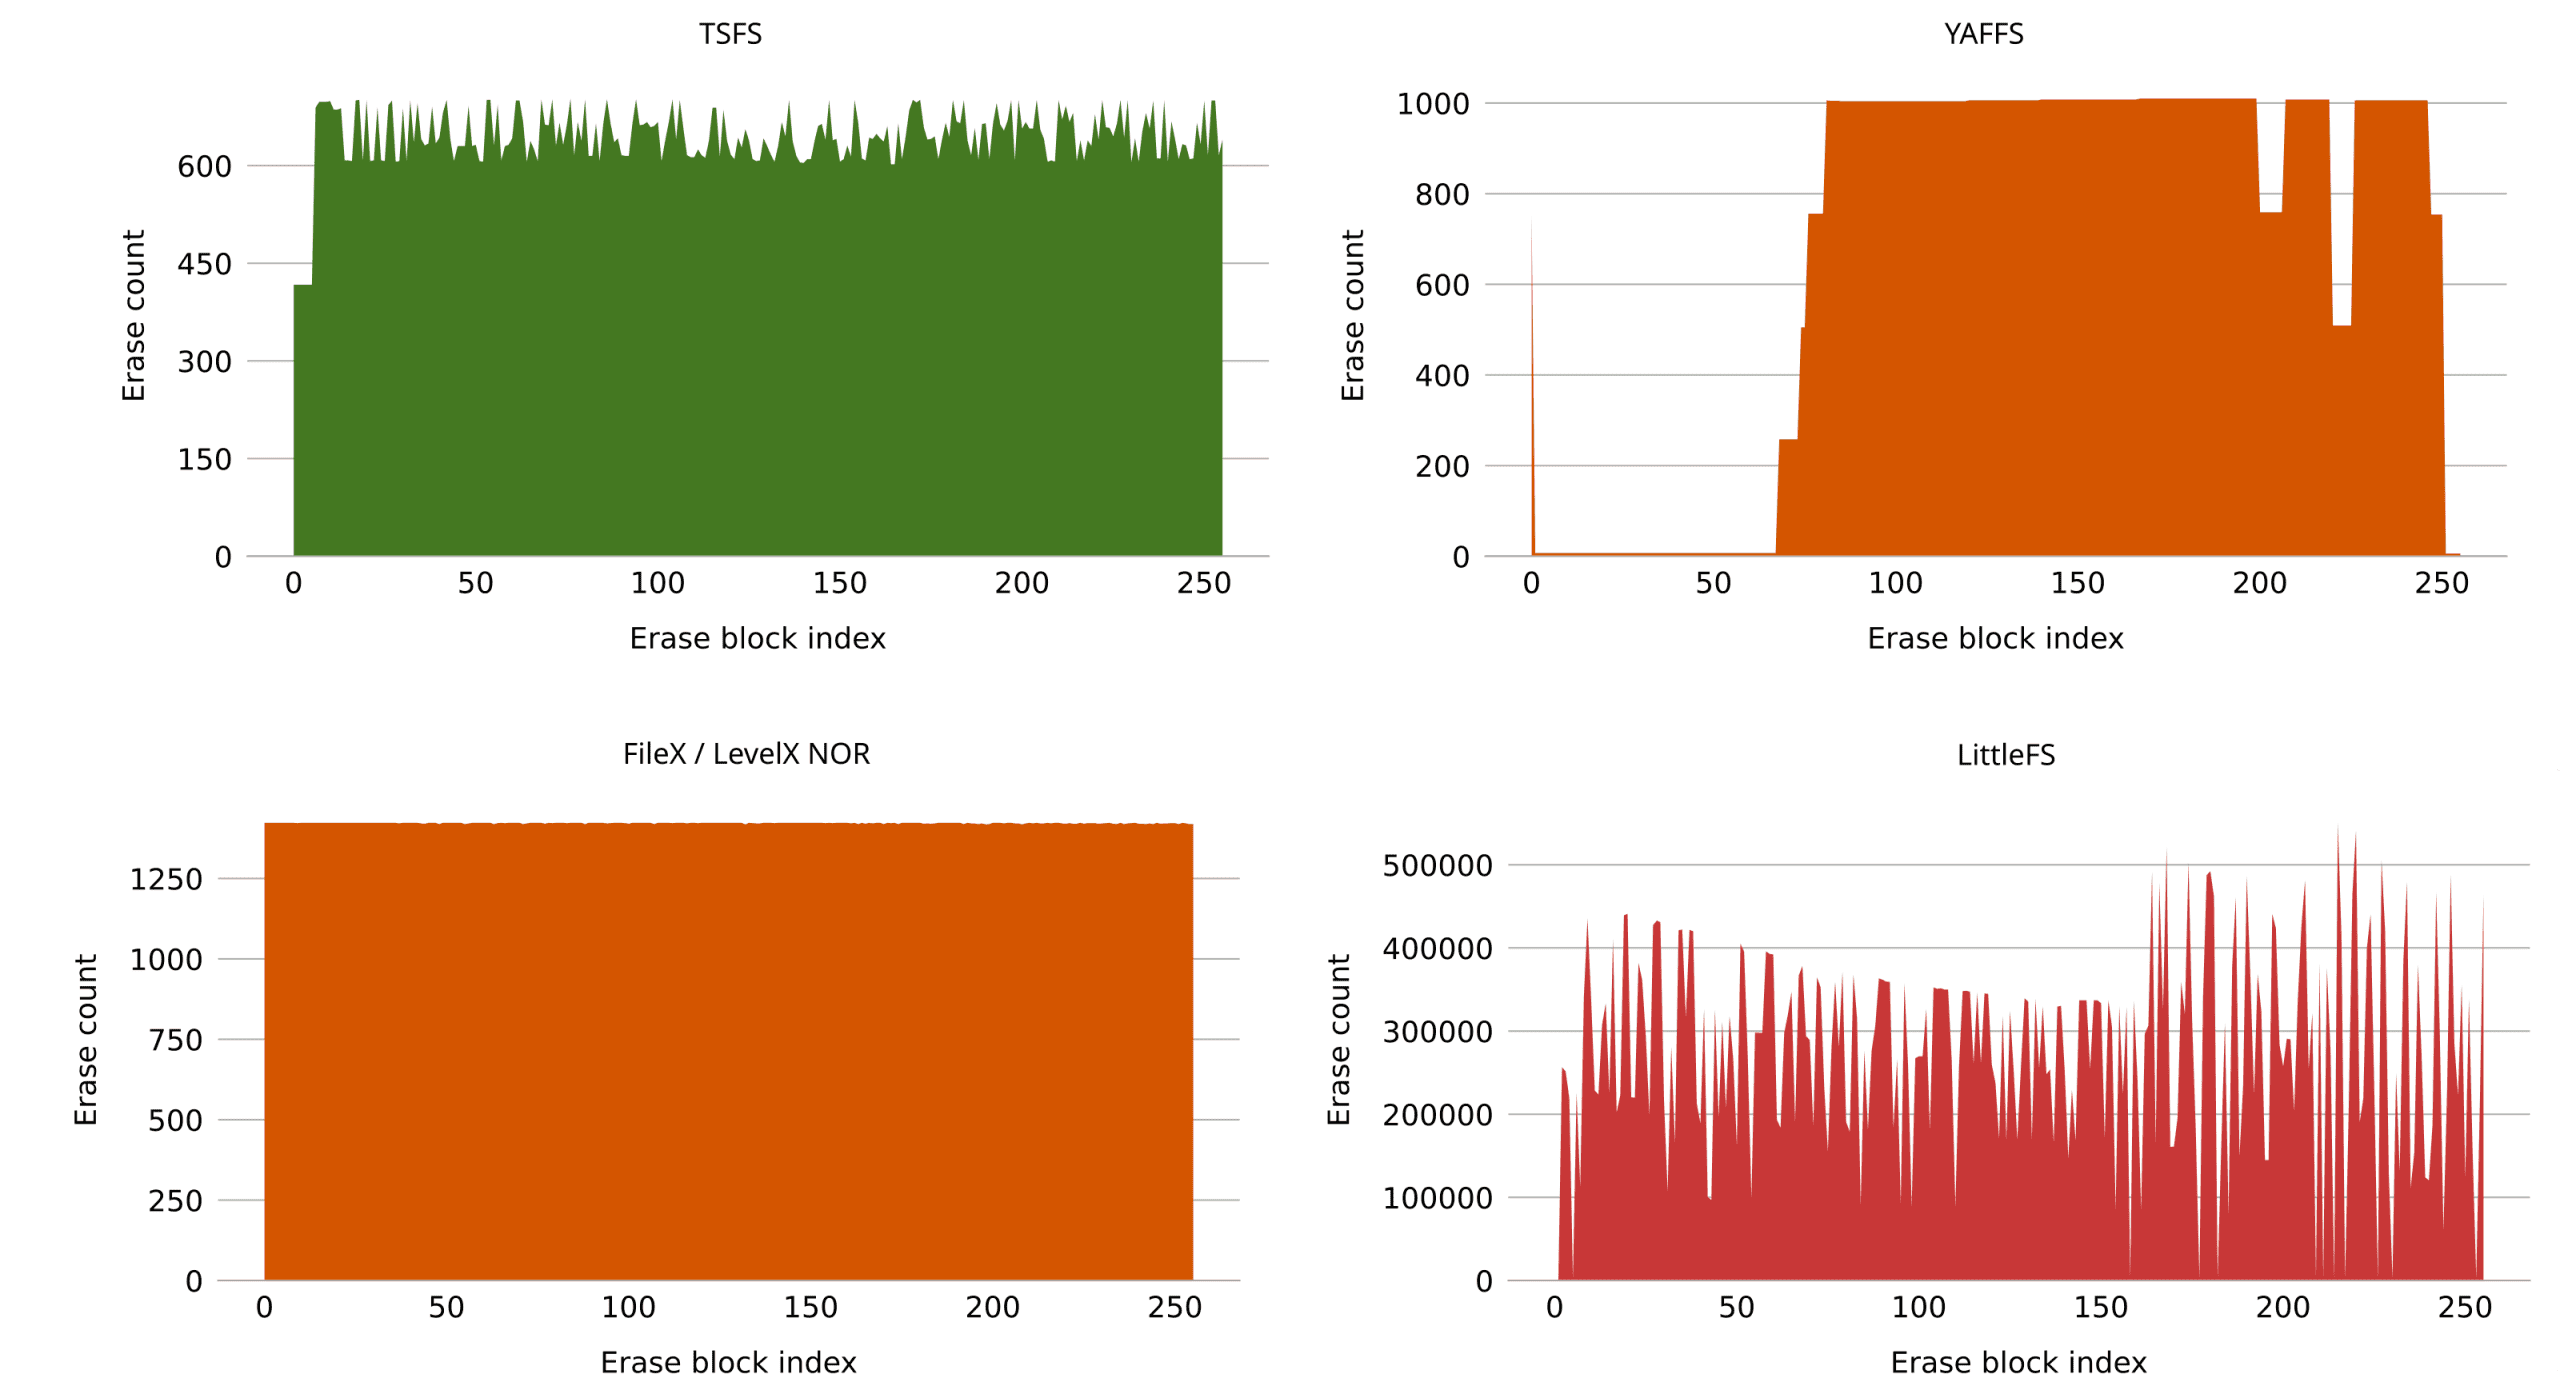
Looking at wear distributions, the variety of contours immediately catches the eye. In this benchmark, the entire flash is written 512 times in total so, given an ideal file system, each block should be erased exactly 512 times. Looking at Figure 8, we can see that TSFS lands pretty close to that mark. The distribution is not perfectly flat but this is in face a desired feature as we will discuss shortly.
Filex/LevelX on NOR flash has a perfectly even distribution, but the write amplification is twice as high. Not great but still acceptable. On NAND flash however, the write amplification is extremely high. This is shown in Figure 9. Remember that LevelX NOR and LevelX NAND are separate code bases, so having different behaviours on NOR and NAND is somewhat expected. Here, however, the discrepancy is extreme.
Going back to Figure 8, we can see that Yaffs has a very uneven distribution, with some blocks remaining untouched while others are erased 1000 times. This is, however, not as bad as it seems. Yaffs simply allows for more temporary variations across different blocks, which is confirmed by running the same benchmark again, though, this time, with more write accesses. Looking at Figure 10, we can see how, given enough time, Yaffs does indeed spread the wear more evenly. Also, note that the write amplification is very low.
Finally, LittleFS performances are poor, both in terms of wear-levelling and write amplification, consistent with previous benchmarks. If we once again modify the benchmark such that test files are deleted upon reaching their maximum size (such as to avoid overwriting), the results significantly improve, as shown in Figure 11. Overall performances, though, still remain much worse than Yaffs and TSFS.
To put things into perspective, Table 7 shows flash wear for each tested file system as a percentage of the flash expected lifetime. We assume a life expectancy (or endurance) of 100K erase cycles, which is typical of both NOR and SLC NAND flash. For reference, an ideal file system should burn through approximately 0.5% (512 / 100K) of its expected lifetime during this benchmark. Looking at Table 7, we can see that both TSFS and Yaffs closely match this optimal value. FileX on NOR flash is not too far off either. On the other hand, FileX on NAND eats up a staggering 75% of the expected lifetime, while LittleFS completely wears out the flash three times over.
| TSFS | Yaffs | FileX/LevelX NOR | FileX/LevelX NAND | LittleFS |
|---|---|---|---|---|
| 0.6% | 0.6% | 1.5% | 75% | 300% |
One final observation regarding wear distribution: one might think that a flatter distribution is always better. However, some amount of variation across individual blocks may actually be a good thing. This is due to competing objectives: on one hand, even wear distribution, and on the other, optimal write throughput. Perfect wear distribution requires that the least erased block be first picked for garbage collection. Optimal write throughput, however, requires that the block with the least amount of valid data be first picked. By allowing some deviation from the perfect wear distribution, performances can be improved without real adverse consequences in terms of flash lifetime. This is indeed why TSFS wear distribution is not perfectly smooth, as we observed earlier.
Read Throughput and Maximum Read Time versus Access Size
As is the case for write performances, read performances are very much impacted by access size and access pattern. Small random-like accesses produce a higher lookup overhead and thus lower overall performances. Some applications only require large sequential accesses for which most file systems offer adequate file systems. However, for applications with more demanding access patterns, in particular where small read accesses at arbitrary positions are the norm, the choice of file system and flash technology can make a huge difference. NOR flash is, in that regard, naturally superior to NAND flash, with extremely low read latency and granular read accesses. As we will see, different flash file systems leverage this natural advantage with varying levels of success, providing equally varying performances at the file level.
Method
Both random-like and sequential read workloads are tested on all file systems with various access sizes. Accesses are performed on a single test file which size is half the size of the simulated device, that is an 8MiB file on NOR and 64MiB on NAND.
In the sequential access case, the access position is increased until the end of the file is reached, at which point the position is reset. In the random access case, the access position is uniformly distributed across the entire file. The test file is prefilled using sequential accesses beforehand. The file is opened before the actual benchmark begins and is closed only at then end.
Results and Discussion
Table 8 and Table 9 show sequential read throughputs and maximum read times obtained on NOR and NAND flash, for each file system and for various access sizes. Table 10 and Table 11 show corresponding results for random workloads.
| NOR (MB/s) | NAND (MB/s) | ||||||||
|---|---|---|---|---|---|---|---|---|---|
| 256 | 512 | 1024 | 2048 | 4096 | 1024 | 2048 | 4096 | 8192 | |
| TSFS | 37 | 39 | 40 | 40 | 40 | 13 | 14 | 14 | 14 |
| Yaffs | 38 | 38 | 38 | 39 | 39 | 13 | 13 | 14 | 14 |
| Filex w/o journal | 4 | 36 | 36 | 37 | 37 | 13 | 13 | 13 | 13 |
| Filex w/ journal | 2 | 4 | 2 | 6 | 33 | 10 | 11 | <1 | <1 |
| LittleFS | 39 | 39 | 37 | 35 | 35 | 12 | 12 | 11 | 11 |
| NOR (us) | NAND (us) | ||||||||
|---|---|---|---|---|---|---|---|---|---|
| 256 | 512 | 1024 | 2048 | 4096 | 1024 | 2048 | 4096 | 8192 | |
| TSFS | 18 | 20 | 33 | 58 | 110 | 605 | 303 | 454 | 757 |
| Yaffs | 27 | 27 | 27 | 53 | 105 | 152 | 152 | 304 | 607 |
| Filex w/o journal | 6515 | 4549 | 1881 | 831 | 847 | 2888 | 1672 | 3496 | 8816 |
| Filex w/ journal | 6516 | 6961 | 32839 | 33477 | 8171 | 28424 | 34504 | 64752 | 37392 |
| LittleFS | 462 | 462 | 513 | 871 | 871 | 2722 | 2722 | 5142 | 5141 |
| NOR (MB/s) | NAND (MB/s) | ||||||||
|---|---|---|---|---|---|---|---|---|---|
| 256 | 512 | 1024 | 2048 | 4096 | 1024 | 2048 | 4096 | 8192 | |
| TSFS | 17 | 25 | 30 | 36 | 38 | 3 | 7 | 9 | 11 |
| Yaffs | 10 | 19 | 38 | 39 | 39 | 7 | 13 | 14 | 14 |
| Filex w/o journal | <1 | <1 | 1 | 3 | 6 | 7 | 13 | 13 | 13 |
| Filex w/ journal | <1 | <1 | <1 | 1 | 4 | 2 | 3 | <1 | <1 |
| LittleFS | 1 | 2 | 3 | 5 | 9 | <1 | 1 | 2 | 3 |
| NOR (us) | NAND (us) | ||||||||
|---|---|---|---|---|---|---|---|---|---|
| 256 | 512 | 1024 | 2048 | 4096 | 1024 | 2048 | 4096 | 8192 | |
| TSFS | 17 | 23 | 36 | 58 | 110 | 454 | 303 | 454 | 908 |
| Yaffs | 27 | 27 | 27 | 53 | 105 | 152 | 152 | 304 | 606 |
| Filex w/o journal | 6535 | 5972 | 4572 | 3894 | 3554 | 2888 | 1672 | 3496 | 8816 |
| Filex w/ journal | 6533 | 6515 | 11664 | 12258 | 5536 | 8056 | 7448 | 24928 | 37392 |
| LittleFS | 456 | 474 | 617 | 1026 | 1077 | 3932 | 3933 | 7259 | 7262 |
In both sequential and random read benchmarks, FileX stands out with the poorest overall performances. In the sequential case, we can see that FileX does significantly better when the journal is disabled. It may seem odd that journalling would affect read performances like that. It all comes from the fact that FileX, when journalling is activated, performs out-of-place cluster updates, which means that even when the file is sequentially written (as is the case in the benchmark setup phase) clusters are not sequentially allocated. The result is more time spent following cluster chains during following read accesses, and a consequential drop in average throughput.
LittleFS exhibits very high sequential read throughputs, although the maximum read times are on the higher side. Random read performances, on the other hand, are pretty poor, although slightly better than FileX with the journal enabled.
Yaffs and TSFS both offer excellent overall read performances. Yaffs performs better on NAND flash in the random read case, which is expected since Yaffs does not have to browse on-disk indexing structures. This level of performance comes at a cost though: in their respective configurations for this benchmark, Yaffs uses approximately 120KB of RAM while TSFS uses 20KB.
Average Read Throughput versus Fragmentation
Fragmentation occurs when logically consecutive file blocks or sectors are not consecutively allocated, but rather, scattered across the entire storage device. Depending on the file system, and to some degree, on the flash technology, fragmentation can have a huge impact on both read and write performances. The FAT file system (which FileX implements) is notoriously vulnerable to fragmentation, but other file system implementations can be affected too. In some cases, fragmentation can be avoided by preallocating files, but that might not always be possible. In any case, opting for a file system that is immune to fragmentation can save you many headaches.
Method
For this test we perform 4KiB sequential and random-like read accesses on a single test file. Similar to previous tests, the file size is half of the device size, that is 8MiB on NOR and 64MiB on NAND. The main difference resides in how the file is prefilled before the actual benchmark begins. In this case, two files are created: the test file and a dummy file. The two files are filled using sequential accesses, alternating between the two files every N accesses, where N can be increased or decreased to produce fragments with a specific target size. Once the test file has reach the desired size (either 8MiB or 16MiB), the dummy file is deleted and the test begins.
Results and Discussion
Table 12 shows average random read throughputs for different levels of fragmentation on all tested file systems. Outside of FileX with the journal enabled, fragmentation does not make a huge difference. Overall, file systems maintain their respective levels of performance, either good or bad, regardless of fragmentation.
| NOR flash | NAND flash | |||||
|---|---|---|---|---|---|---|
| No frag. | 1MiB frag. | 64KiB frag. | No frag. | 1MiB frag. | 64KiB frag. | |
| TSFS | 38 | 38 | 36 | 9 | 9 | 9 |
| Yaffs | 39 | 39 | 39 | 13 | 13 | 13 |
| Filex w/o journal | 6 | 6 | 3 | 12 | 6 | 0.5 | Filex w/ journal | 4 | 4 | 4 | 0.5 | 0.5 | 0.5 |
| LittleFS | 9 | 9 | 9 | 2 | 1 | 1 |
Mount Time
Mount time can vary quite a lot across file system implementations. For instance, log-structured file systems (like Yaffs) must typically scan large amounts of on-disk metadata in order to reconstruct in-RAM structures. That can significantly extend the mount process. Even for one specific implementation, time can vary substantially across mount cycles, especially after a sudden power-failure or other untimely interruption. When that happens, some file systems, most notably those relying on journalling to prevent file system corruption like FileX, need to perform some sort of post-mount cleanup which can generate quite a lot of extra write accesses and, once again, increase mount duration.
Method
We perform two different benchmarks. In both benchmarks, the maximum and average mount times are measured over 100 mount cycles, with each cycle separated by some amount of write accesses on a single test file. In the first benchmark, we only do “clean” mount cycles, where the test file is closed before the file system is explicitly unmounted using the dedicated API. In the second benchmark, we only do “unclean” mount cycles, where the test file is left open and the file system is not unmounted. Instead, the file system instance is reset before the next test iteration, much like it would in the event of a power-failure.
Results and Discussion
Table 13 shows the average and maximum mount times for each file system, both in the case of a complete mount-cycle (clean) and in the event of a sudden interruption (unclean).
| Clean | Unclean | |||||||
|---|---|---|---|---|---|---|---|---|
| NOR (ms) | NAND (ms) | NOR (ms) | NAND (ms) | |||||
| Average | Maximum | Average | Maximum | Average | Maximum | Average | Maximum | |
| TSFS | 4 | 4 | 35 | 37 | 4 | 4 | 35 | 36 |
| Yaffs | 0.5 | 0.5 | 7 | 83 | 6 | 6 | 346 | 359 |
| FileX/LevelX | 4 | 8 | 185 | 395 | 18 | 29 | 222 | 495 |
| LittleFS | 0.3 | 0.8 | 15 | 29 | 0.3 | 0.8 | 14 | 29 |
Let’s fist consider the “clean” mount benchmark. Overall, all file systems perform pretty well, FileX/LevelX having the longest mount cycle of all. Also, all file systems do better on NOR flash which is expected since NOR flash offers higher raw read performances than NAND flash.
Now looking at the “unclean” benchmark, we can see that TSFS and LittleFS behave exactly the same regardless of whether the file system went through a proper mount cycle or was abruptly interrupted. This is indeed consistent with both file systems designs. FileX and Yaffs, on the other hand, exhibit substantially longer mount times in the “unclean” case. The difference is particularly striking in the case of Yaffs. This is because, during a clean unmount, Yaffs dumps crucial in-RAM structures on-disk in the form of a so-called checkpoint, which considerably speeds up the subsequent mount process. In the event of a sudden interruption, however, no checkpoint is available, which means that Yaffs must perform an exhaustive scan to reconstruct in-RAM structures.
Overall, LittleFS and TSFS have the shortest worst-case mount time, which is what usually matters the most in terms of application design.
Conclusion
In this article we presented, in depth, the features, advantages and disadvantages of four popular, embedded flash file systems. The article highlights the old adage that everything is a tradeoff, especially in terms of file system on resource-constrained devices.
As usual, thank you for reading. If you need advice on anything related to embedded storage or embedded systems in general, please feel free to contact us or take a visit to discover our very own file system TSFS.