A PDF version of this guide, including project setup and debugging is available in the Documentation section
This guide is aimed at IAR Embedded Workbench users who are interested in integrating the IAR tools within Eclipse. For instructions relating to integrating GCC within Eclipse see this guide.
Welcome to this fourth and last guide in this series of step-by-step guides on setting up and using the IAR Embedded Workbench within the Eclipse IDE. In this guide we’ll quickly look at creating a debug configuration either for the managed build project from part 2 or the Makefile project from part 3. Creating a debug configuration for an IAR project within Eclipse isn’t much different from the usual Eclipse CDT debug configuration other than the IAR C-SPY specific options.
Debug Configuration
With a built project and said project open within Eclipse it is now time to create a debug configuration to load the application image to a target and debug it.
Start by searching for and clicking the “Run->Debug Configurations” menu. Not that while it is possible to create a debug configuration by right-clicking the project root and selecting “Debug as.” this will launch a debug session without having the chance to configure it first which is almost certainly not the desired outcome.
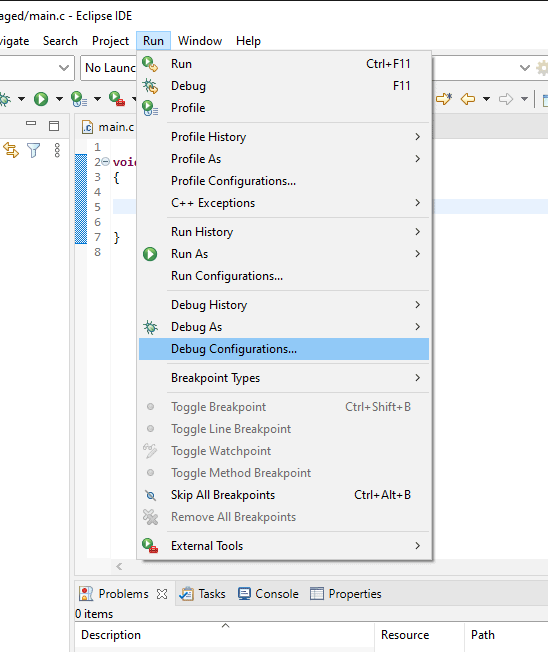
The Debug Configurations panel should appear.
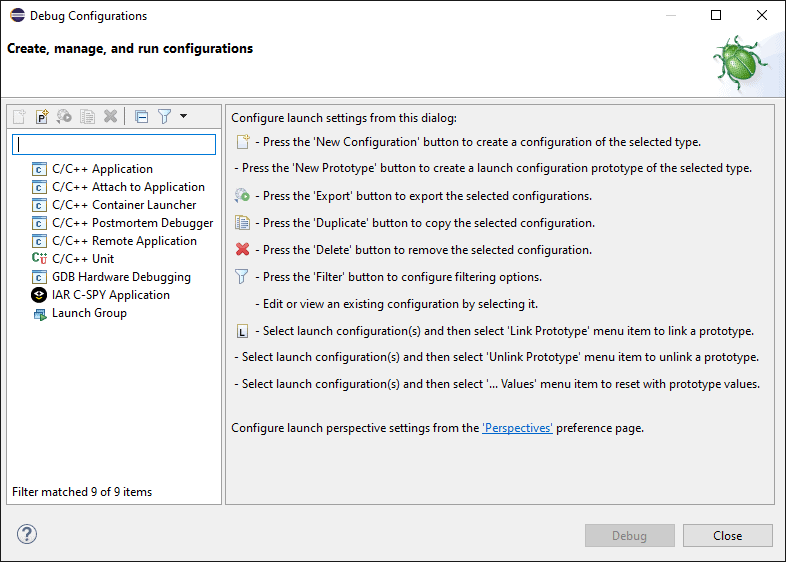
On this panel right-click on “IAR C-SPY Application”.
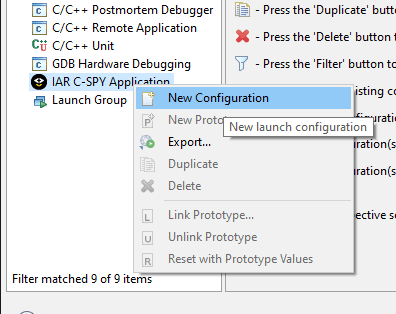
From the context menu select “New Configuration”. This should create a new debug configuration and display it in the right pane.
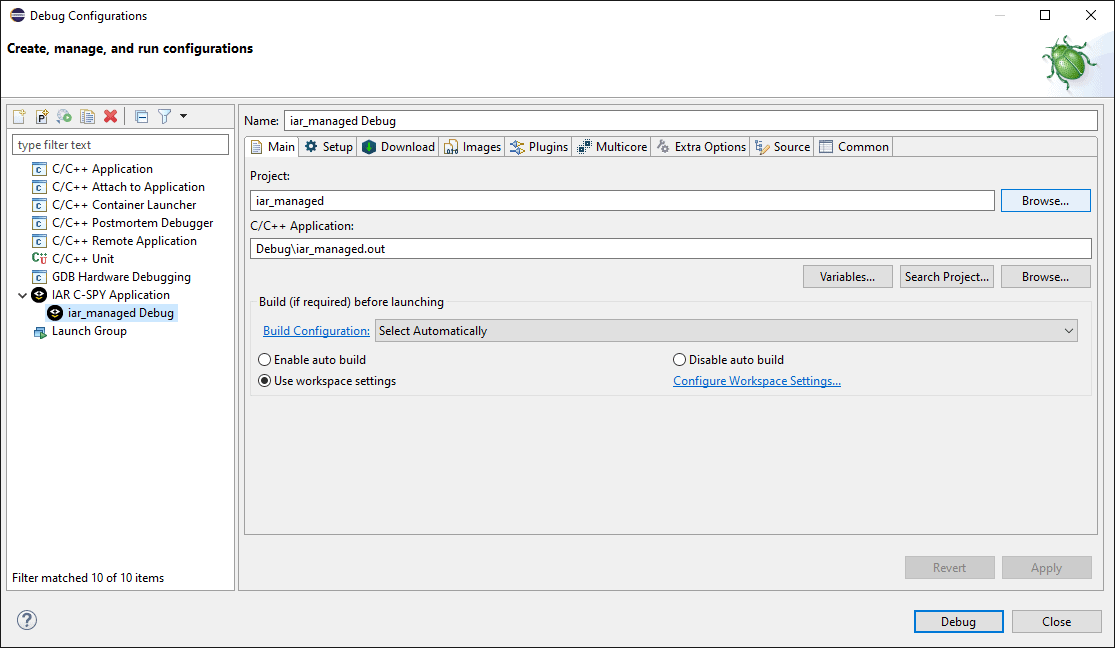
By default the newly created configuration will be associated with the active project. In our example it is also the only project in the workspace. However, if for some reason the wrong project or no project is displayed in the “Project:” field click the “Browse” button to select the correct project from a list of projects available in the workspace.
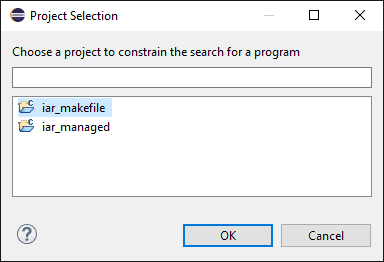
In a similar fashion, verify that the ”C/C++ Application:” field points to the correct executable binary todebug. If it is incorrect or left empty click ”Browse…” underneath the field to select a binary file.
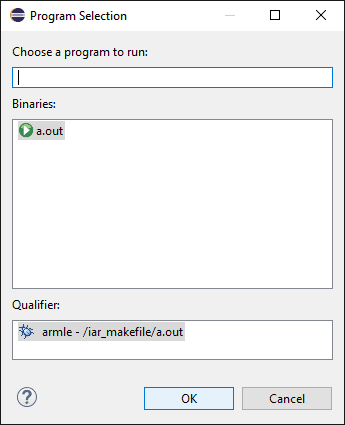
From the selection dialog select the binary file to debug. If nothing is displayed make sure that the project was built correctly. Also if the binary file has an unknown extension, other than ”.out” or ”.axf” for example, it may be necessary to manually type the name of the file instead. Once done click ”OK”
Next let’s look at the debug connection setup by selecting the “Setup” pane.
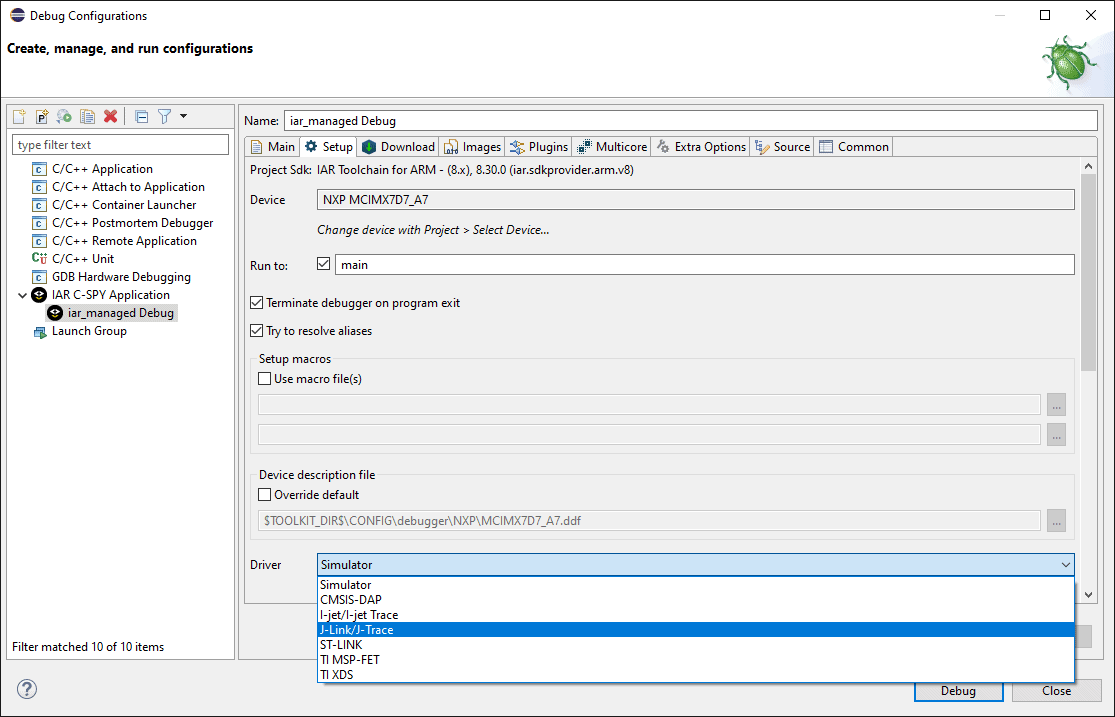
By default IAR will launch a debug session into the IAR Simulator. To use a real hardware target a suitable debug probe must be selected and configured. The exact configuration required for each target and debug probe combination is beyond the scope of this guide. As an example this guide will use the J-Link debug probe.
Once the proper debug probe is selected click “Debug” to launch the debug session.
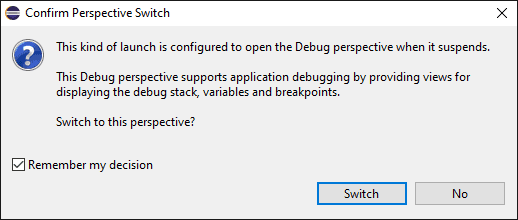
Eclipse will probably warn that launching a debug session is associated with the “Debug” perspective. Clicking “Switch” will rearrange the selection of panels within Eclipse to show the views relevant to debugging. Checking “Remember my decision” will stop Eclipse from asking the same question each time a debug session is launched.
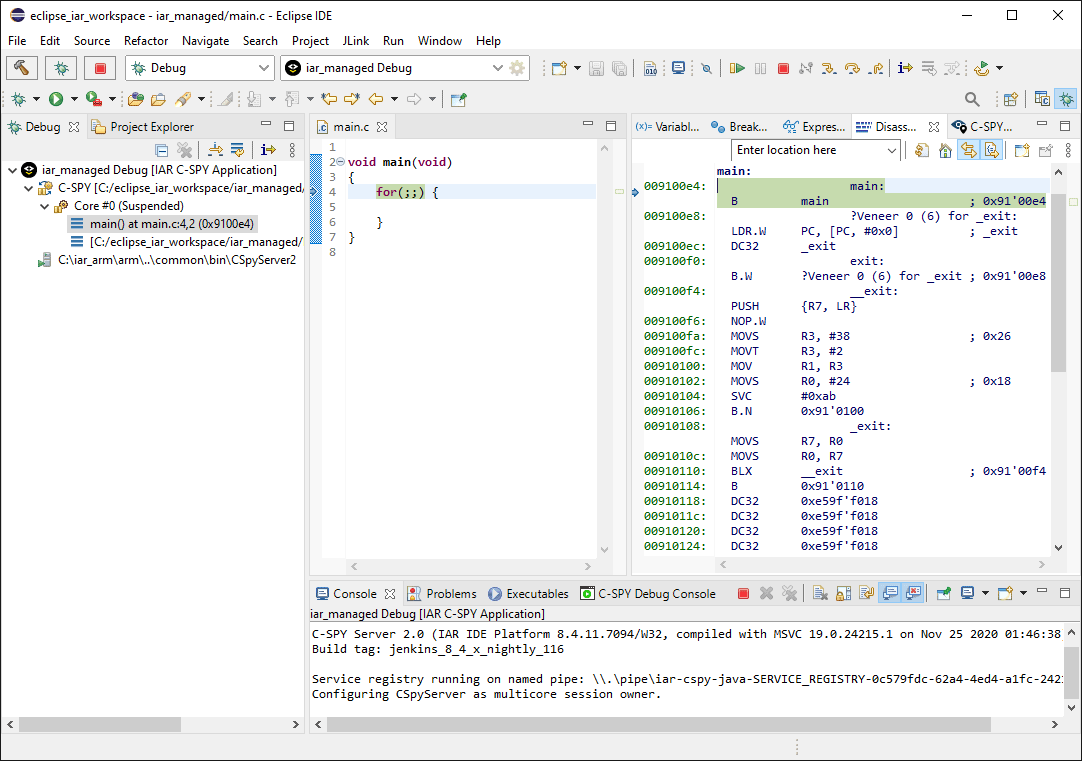
If all goes well, the debug session should now be active with the application halted at the main function created in the previous section. Pressing the stop button will terminate the current debug session. It is also possible to return to the C/C++ perspective by clicking the icon next to the small green bug near the top right corner of the IDE.
This concludes our series of guides on getting and using the IAR tools within Eclipse using the IAR Eclipse plugin.
Click here to go back to part 1 of this series.
Visit the Documentation section for a PDF version of this guide including project and debugging setup.