A PDF version of this guide, including Eclipse setup and project debugging is available in the Documentation section.
This is the fourth part of this article series on setting up a bare-metal GCC toolchain in Eclipse. The previous two articles, part 2 and part 3 dealt with creating Eclipse CDT projects using the managed build and Makefile project types. In this article we’ll look at the last step which is creating and launching a debug configuration for the project. The kind of project managed or Makefile base does not affect the debugging process so these instructions applies to both types of projects.
Debug Configuration
Many debug probes and targets supports acting as a GDB server. Which means that they can be debugged using GDB either remotely or from the same host. The exact steps required to start a GDB server are outside the scope of this guide but once the GDB server is running it’s easy to connect through it from Eclipse. This guide assumes that the GDB server is started on the local host, in which case it’s important to note the port number in use by the GDB server. The port number is usually prominent in the server configuration if a GUI tool was used to start the server. Otherwise the port number is usually specified on the command line when starting gdbserver from a shell.
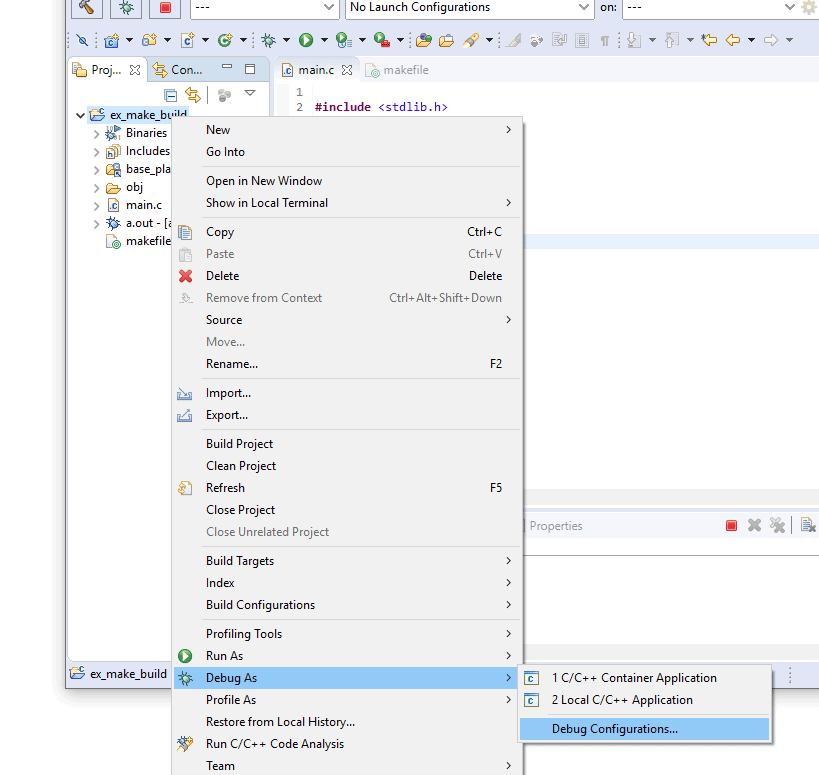
First open the “Debug Configurations” menu by right-clicking on the project and selecting the “Debug As->Debug Configurations” menu entry. It’s recommended to use this method to open the “Debug Configurations” dialog as it will make it easier to create a new debug configuration for the project.
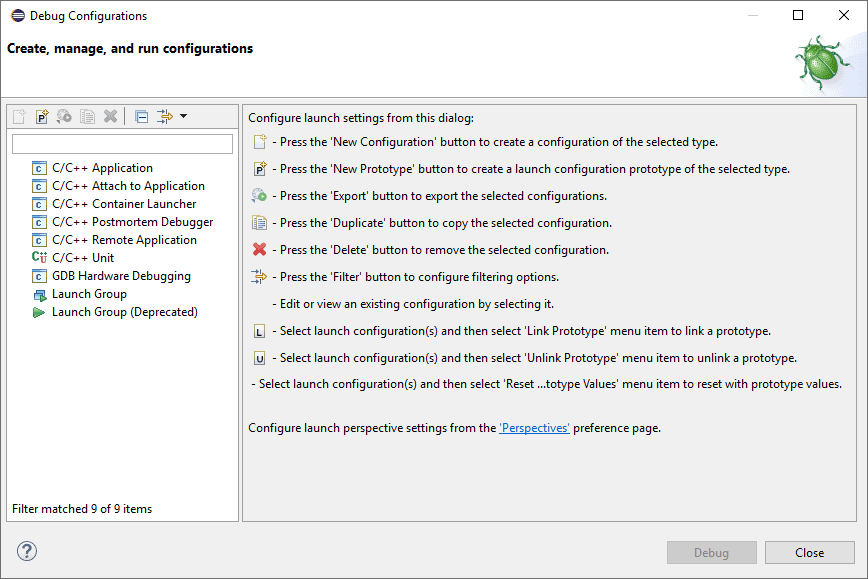
This will open the “Debug Configurations” panel.
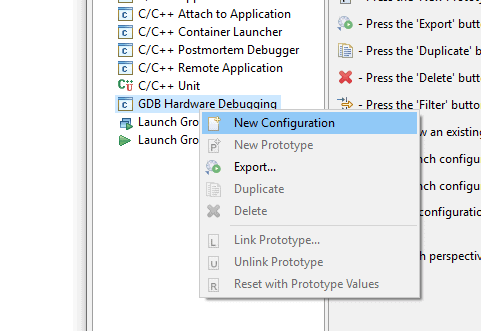
Right click on “GDB Hardware Debugging” and select “New Configuration”.
This will create and populate a new debug configuration for the selected project. Eclipse CDT will attempt to guess the name of the executable file. Check that the content of the “C/C++ Application” box match the target executable to debug.
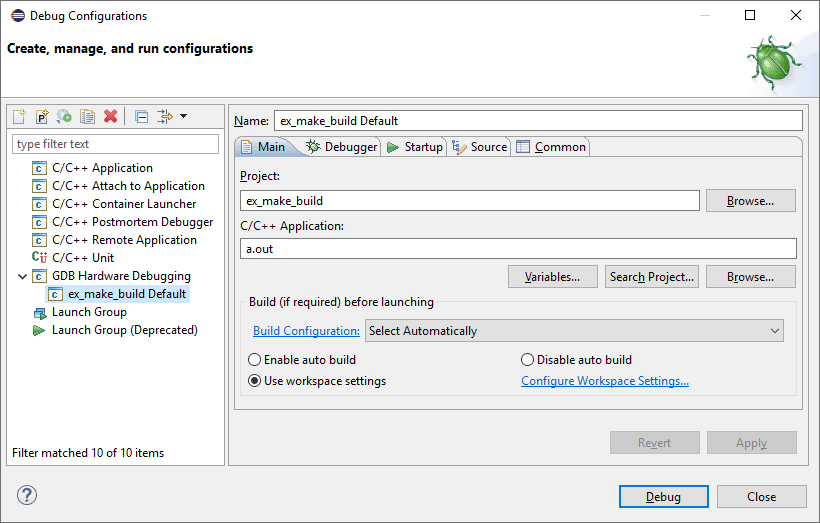
Open the “Debugger” tab for further configuration.
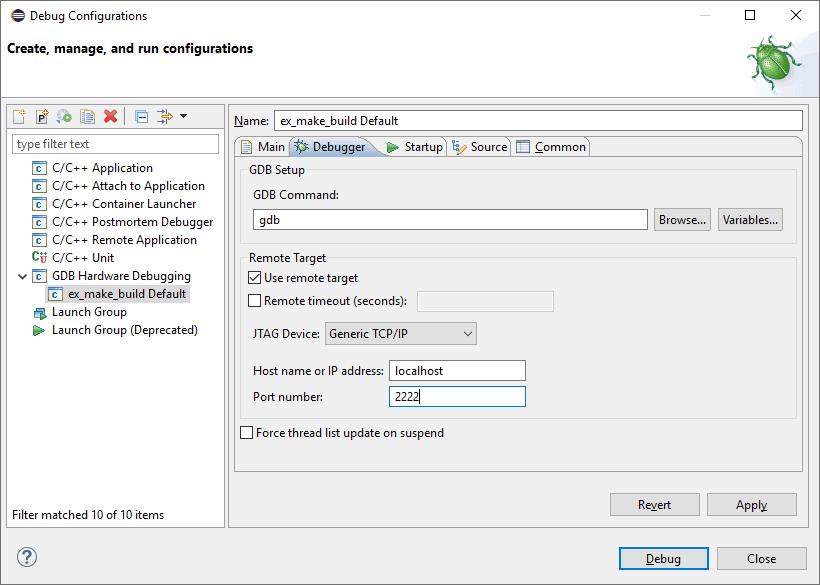
In this panel the host name and port number of the GDB server should be entered. If the server was started on the local host then locahost can be entered or ‘127.0.0.1’. The port number should be the same as the one used when launching the GDB server. In most cases this is sufficient for a debug configuration to work.
Click “Debug” to launch the configuration.
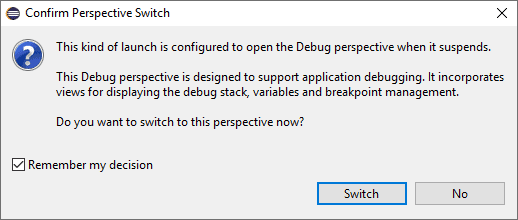
The perspective switch confirmation dialog usually appears to warn the user that the view will be switched to the debugging view. Using the “Remember my decision” checkbox will prevent this dialog from appearing again.
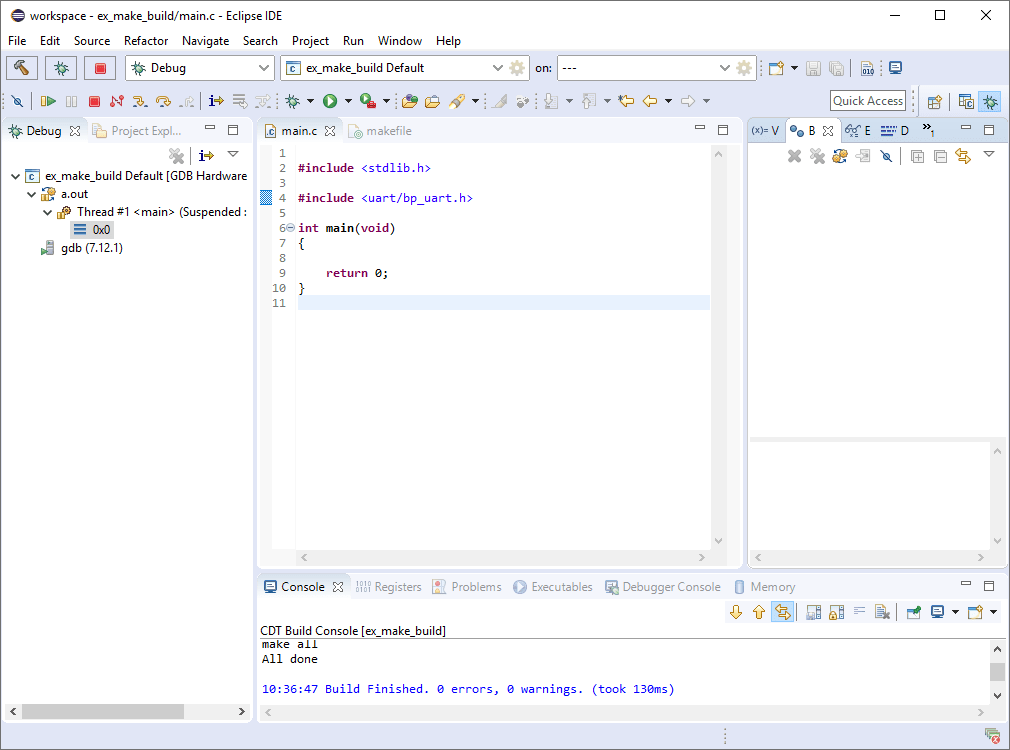
And from this point everything should be ready to build and debug your embedded project using Eclipse.
Check out the previous part 1, part 2 and part 3 of this series which covers toolchain and project setup.
Visit the Documentation section for a PDF version of this guide including Eclipse and debugging setup.
Questions or comments? Do not hesitate to contact us at blog@jblopen.com. Your questions, comments and, suggestions are appreciated.