This article is the first of a series on managed flash storage performances, focusing primarily on SD cards, MMC cards and eMMC modules. Throughout the coming articles, we will discuss performance aspects such as access time distribution, that are not often discussed although crucially important for embedded system designers.
In this article, we start with a detailed discussion of SD card performances, both for consumer and industrial-grade cards. We use a series of carefully designed bare-metal benchmark tests to illustrate and quantify the large variations in performance between individual devices. We also explain why real-world performances are typically much lower than what could be inferred from the manufacturer specifications. In the process, we demonstrate the importance of thorough benchmarking and give some advice on specific performance aspects to look for when selecting SD cards.
Performance Metrics
SD card manufacturers typically provide the following performance data:
- average sequential read/write throughput;
- average random read/write throughput;
In this article, we provide experimental results for these basic metrics. In addition, we measure the access time distribution, which is particularly relevant for embedded systems with tight memory constraints.
Average access throughputs are typically expressed in bytes per seconds (normally KB/s or MB/s), although random access throughputs are alternatively expressed in I/O operations per seconds (IOPS). Here, an I/O operation is a read or write access, small enough that most of the access time is spent by the on-card controller looking up or indexing data (as opposed to programming/loading data to/from the flash array).
Using IOPS to express access speeds makes sense in some circumstances. For instance, in database applications where the workload is dominated by small accesses of variable size. However, IOPS are not particularly helpful for understanding raw device performances. They are even less convenient for our current purposes as we specifically want to compare sequential and random performances. For this reason, all access speeds presented in this article are expressed in bytes per second.
Setup and Methodology
The benchmark used for the purpose of this article covers 4 types of access patterns: random read, sequential read, random write, sequential write. All access positions are aligned on an access size boundary. Random access positions follow a uniform distribution. Each pattern is performed with 8 different access sizes, all powers of two from 512 bytes up to 64 KiB. For each access pattern/size combination, 512 MiB worth of read/write accesses are performed covering a 256 MiB address span.
All accesses are performed at the media driver level (and not at the file level) in a bare-metal configuration running on an STM32F746ZG processor using O2 optimization. The built-in cache is turned on when available, but command queuing is not used. The SD bus is 4-bit wide and clocked at 50 MHz (SDR25).
All tested SD cards are listed in the following table. This selection includes SLC, MLC and TLC NAND implementations as well as a mix of consumer and industrial-grade cards. The product names and manufacturer IDs used to identify the cards throughout the article are directly taken from the PNM and MID fields within the CID register of each card.
| Commercial Product Name | Card Manufacturer | Product Name (CID.PNM) | Manufacturer ID (CID.MID) | Size | NAND Type |
|---|---|---|---|---|---|
| S-46u* | Swissbit | G2000 | 0x5D (Swissbit) | 2GB | PSLC |
| S-45u* | Swissbit | G4000 | 0x5D (Swissbit) | 4GB | MLC |
| S-450u* | Swissbit | 1MB1N | 0x5D (Swissbit) | 512MB | SLC |
| Sandisk Industrial* | SanDisk | G61AS | 0x03 (Sandisk) | 16GB | N/A |
| MURD4* | TDK | 0A4DR | 0x27 (Phison) | 512MB | SLC |
| i200* | Micron | A33CM | 0x09 (Micron) | 32GB | TLC |
| ArmourDrive PX* | Greenliant | 10LOG | 0x27 (Phison) | 32GB | TLC |
| SQFlash* | Advantech | DSFQS | 0x27 (Phison) | 4GB | MLC |
| ISD* | Apacer | DS | 0x74 (Transcend) | 512MB | SLC |
| SanDisk Ultra | SanDisk | G61CS | 0x03 (Sandisk) | 16GB | N/A |
| SanDisk Ultra A1 | SanDisk | G61LS | 0x03 (Sandisk) | 16GB | N/A |
| SDC10G2 | Kingston | BG8DS | 0x41 (Kingston) | 8GB | N/A |
Benchmark Results
Average Throughput
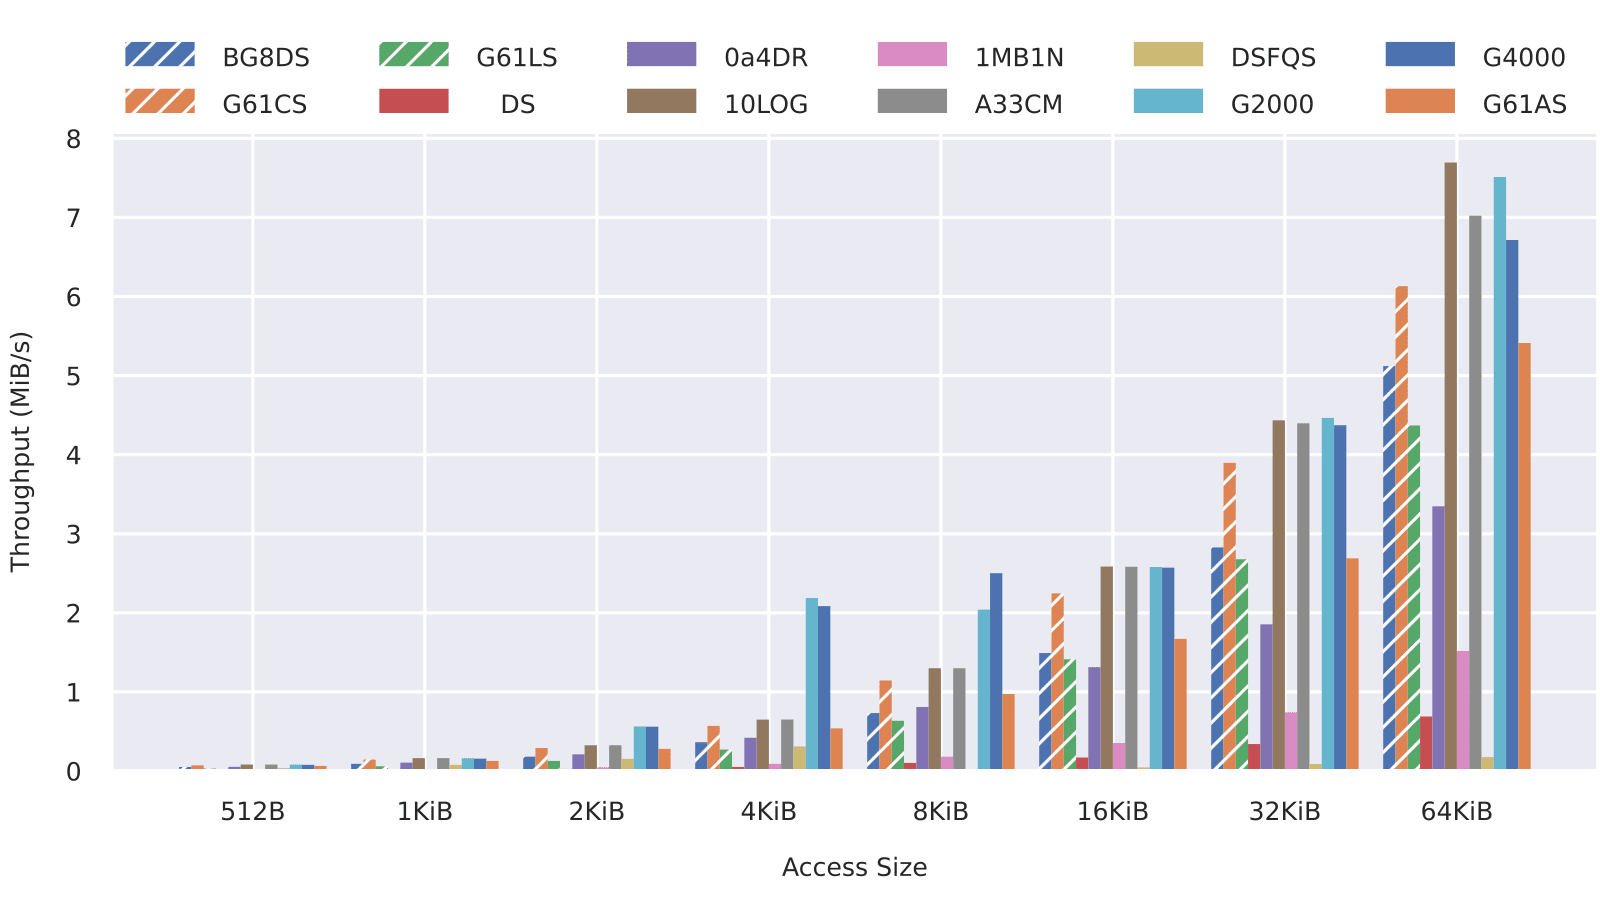
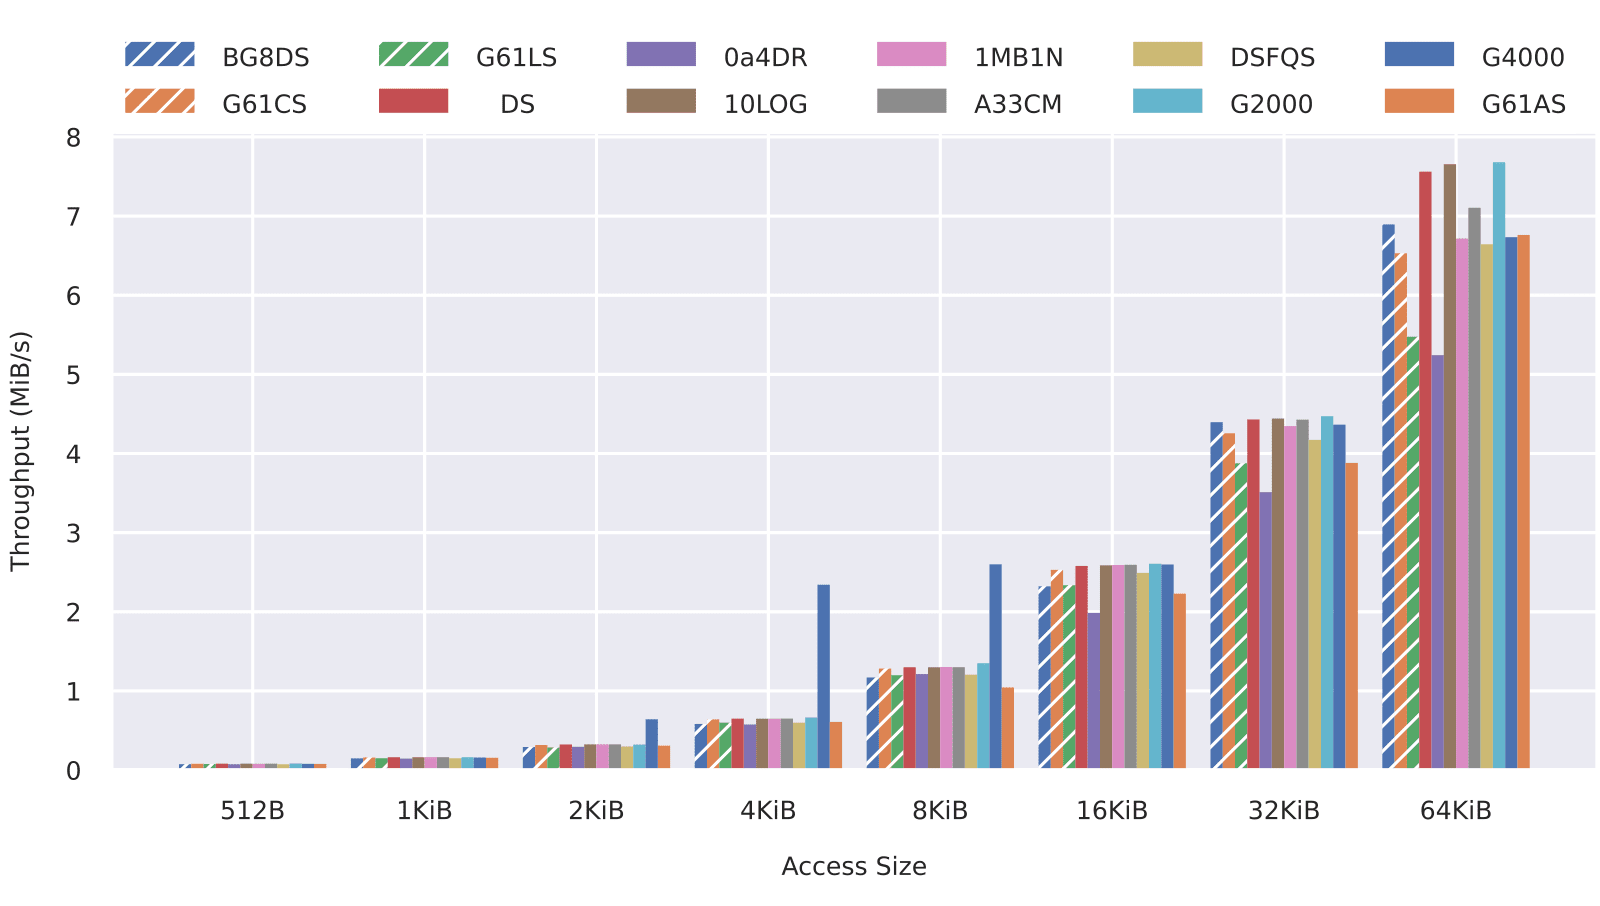
Figure 1 and 2 show the random and sequential read throughputs measured for various access sizes. Figure 3 and 4 do the same for write accesses. Oblique lines are used to identify consumer-grade cards, while industrial-grade cards appear in plain colours.
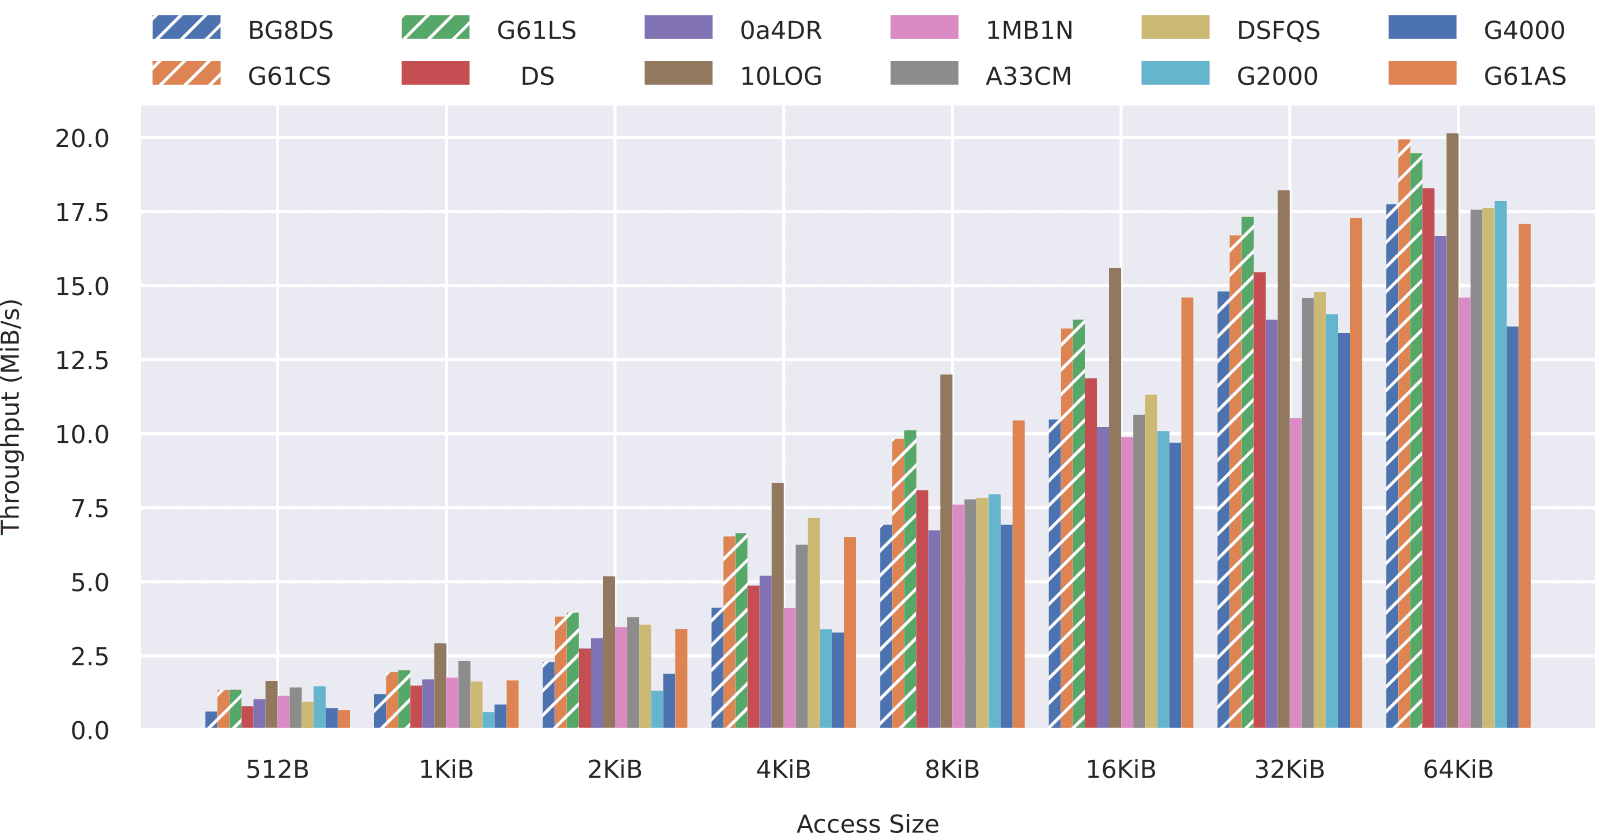
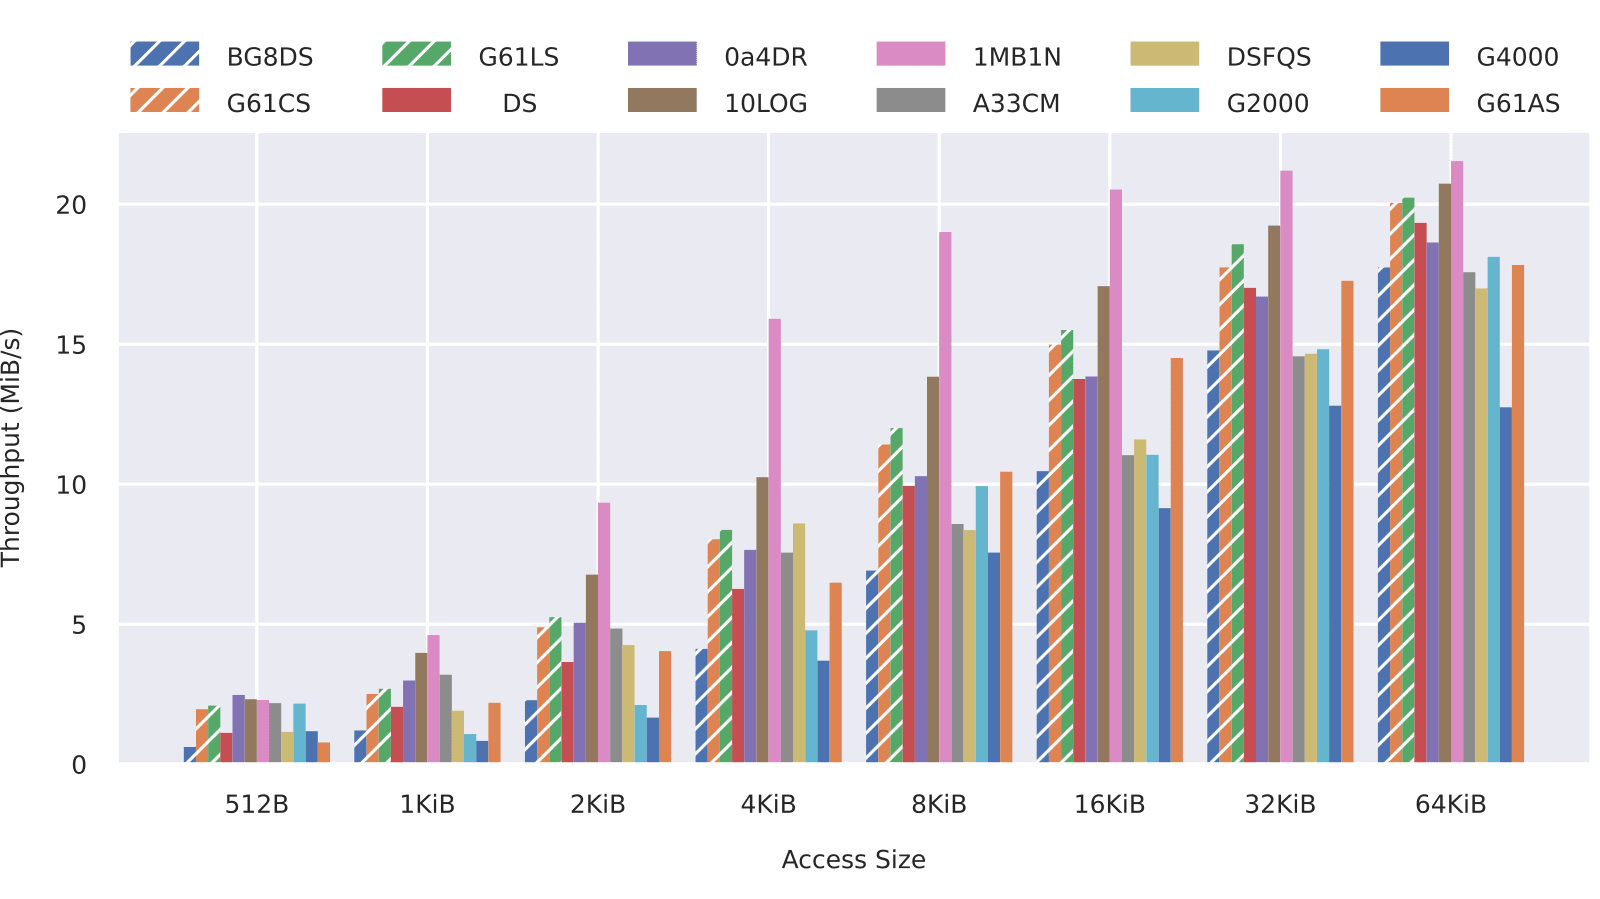
Looking at these graphs, the first thing that catches the eye is how the access speed improves as the access size increases. Eventually, for sufficiently large accesses, the limiting factor becomes either the available bus speed (in this case 25 MB/s) or the maximum program/load rate of the internal flash array. Figure 5 shows the throughputs obtained for different access patterns but a constant access size of 4 MiB. The read accesses are clearly limited by the maximum bus speed, while the write throughput remains well below that limit. Therefore, higher bus speed configurations such as UHS-I (supported by some cards tested here) would only improve read performances and only for large accesses.
At the other end of the spectrum, small access speeds are extremely low compared to the available bus speed. This is true both for read and write accesses such that file system performances would likely be superior on bare flash technologies (NOR or NAND) for this type of workload. On a side note, it is worth mentioning the Swissbit S-46u (G4000) performances which really stand out for small random write accesses.
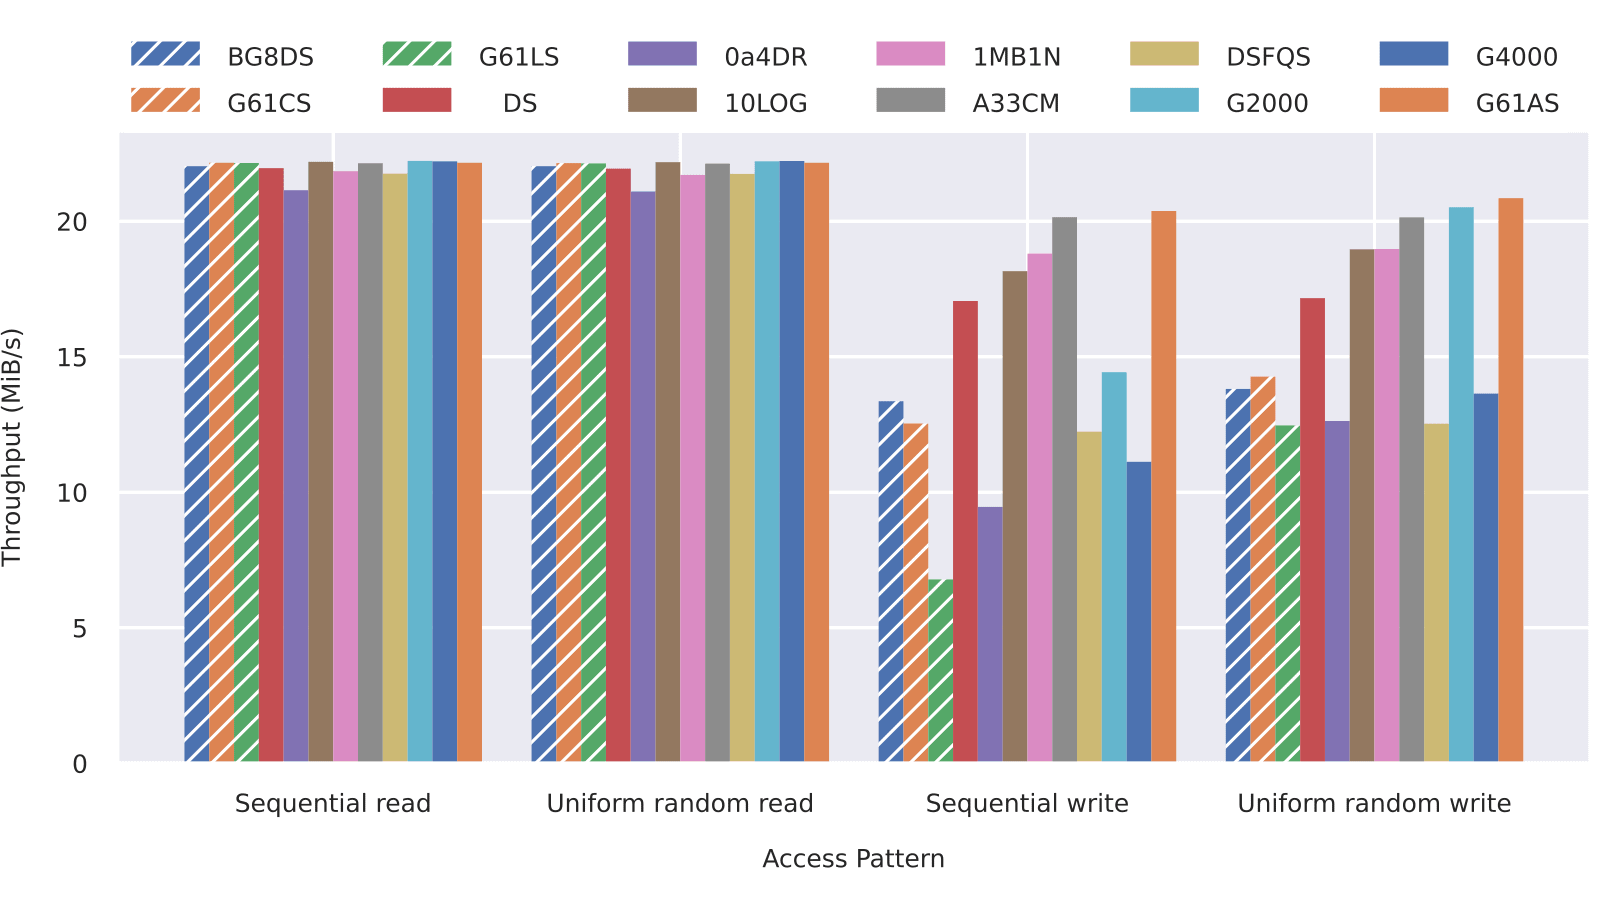
Another thing to note is how close random and sequential performances are for most (but not all) SD cards. Generally speaking, SD cards tend to perform slightly better under sequential workloads. However, among the cards that we have tested, the Swissbit S-450u (1MB1N), the Advantech SQFlash (DSFQS) and the Apacer ISD (DS) cards have very different random and sequential performances. For access sizes between 512 bytes and 64 kilobytes, these three cards show very poor random write performances. Above that, the gap closes rapidly such that, at 4 MiB (see figure 5), random and sequential performances are alike.
Now comparing industrial and consumer-grade cards, nothing clearly stands out. It is true that the highest throughputs have been measured on industrial-grade cards, but the difference is small and our sample size quite limited compared to the global offering.
Maximum Access Time
Figure 6 and 7 show the maximum random and sequential read access times for various access sizes. Figure 8 and 9 do the same for write accesses.
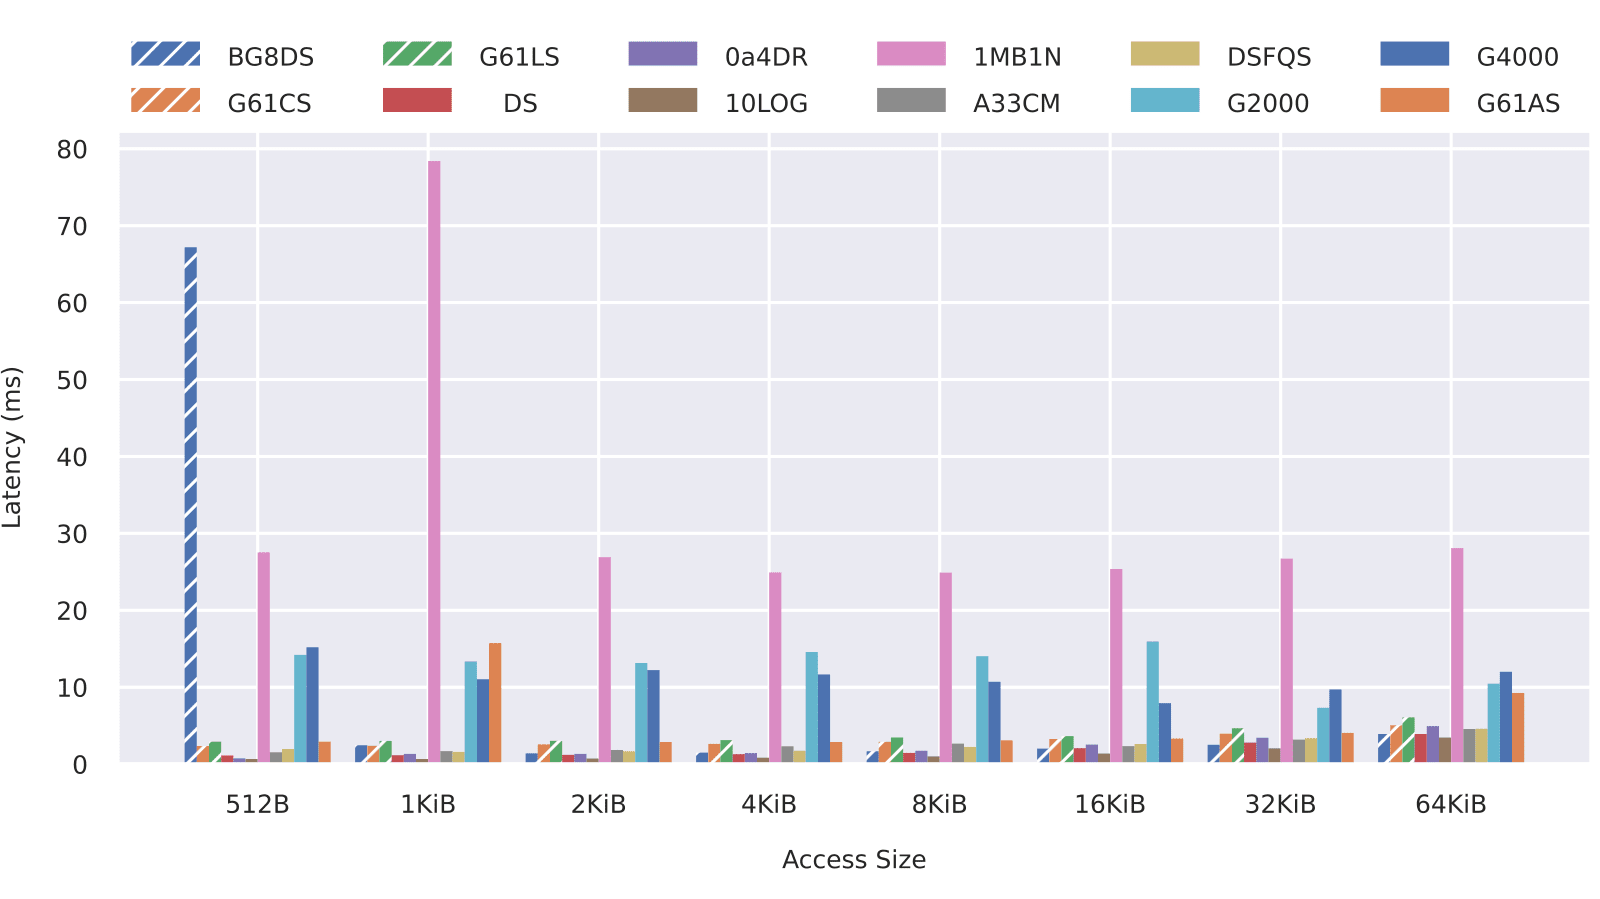
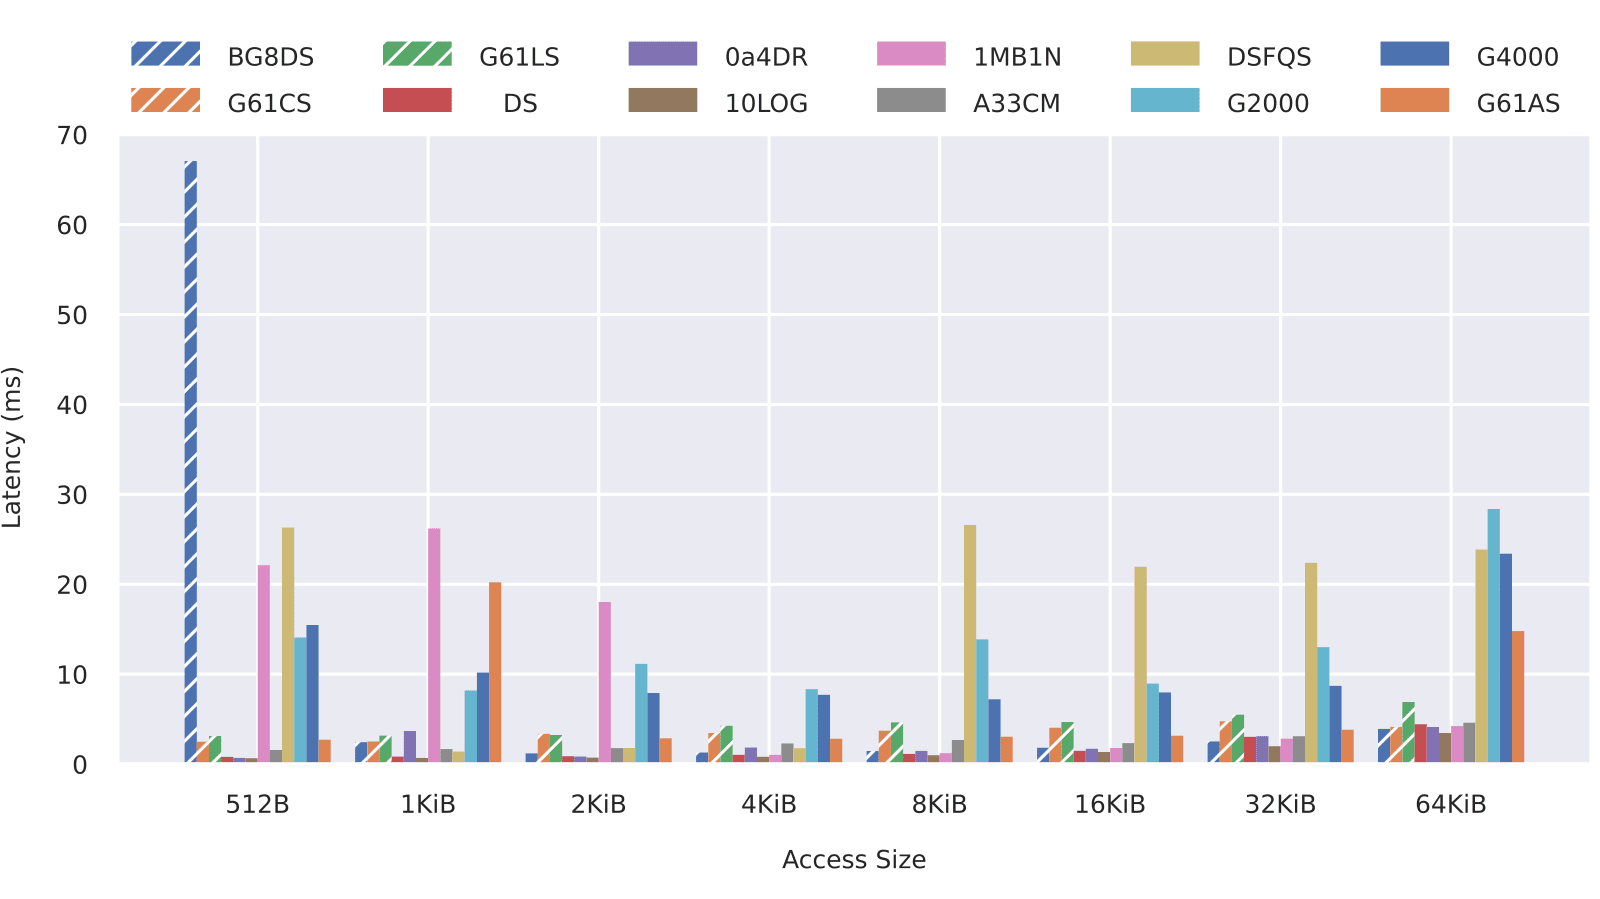
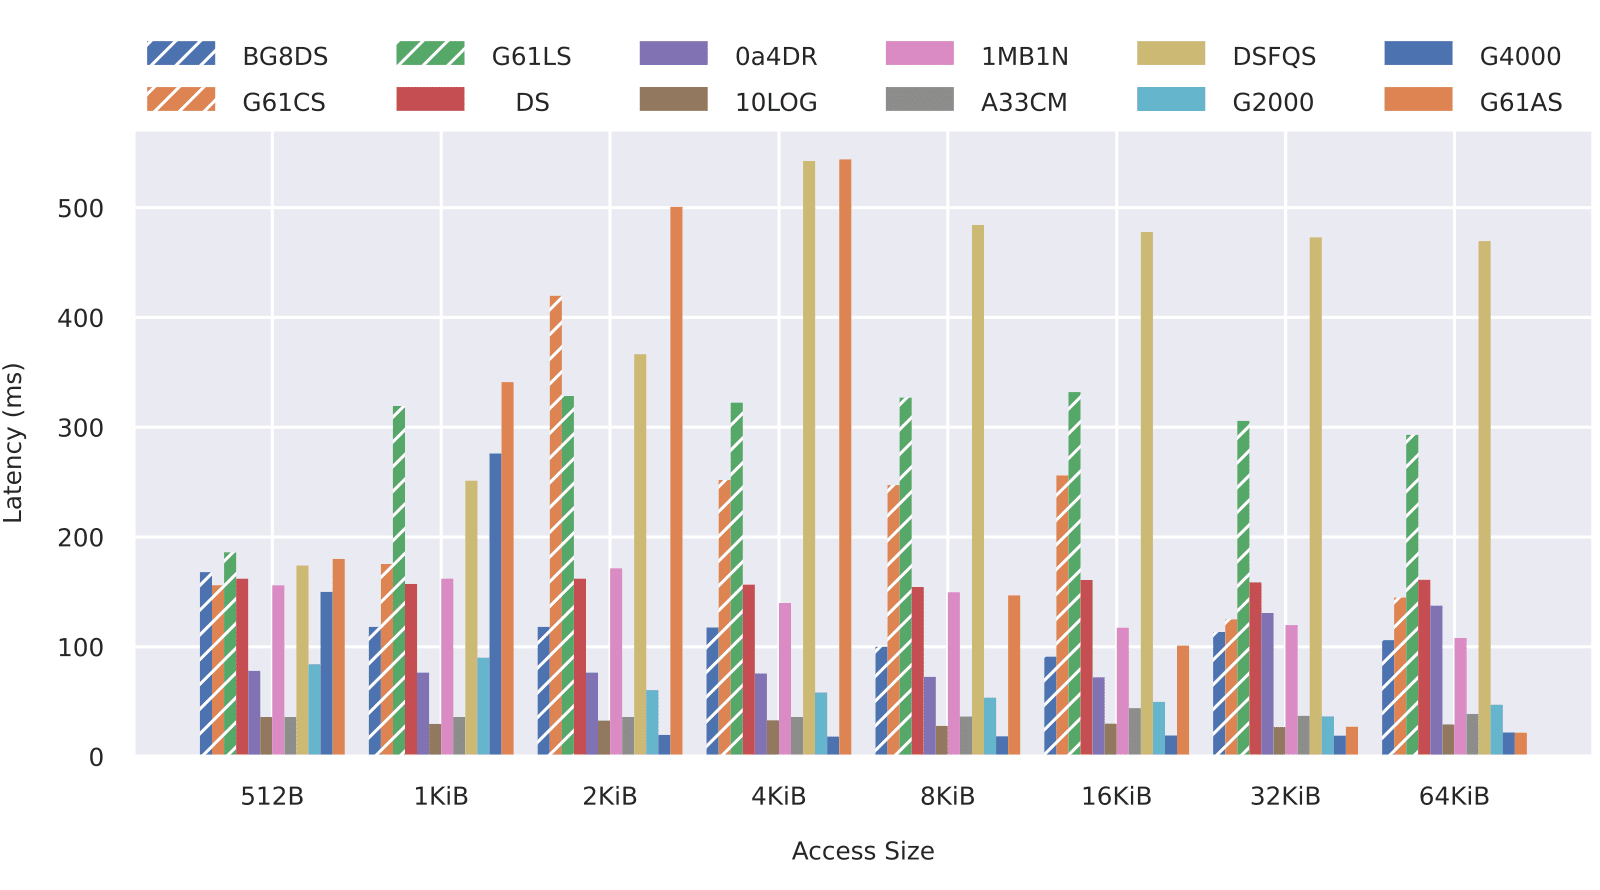
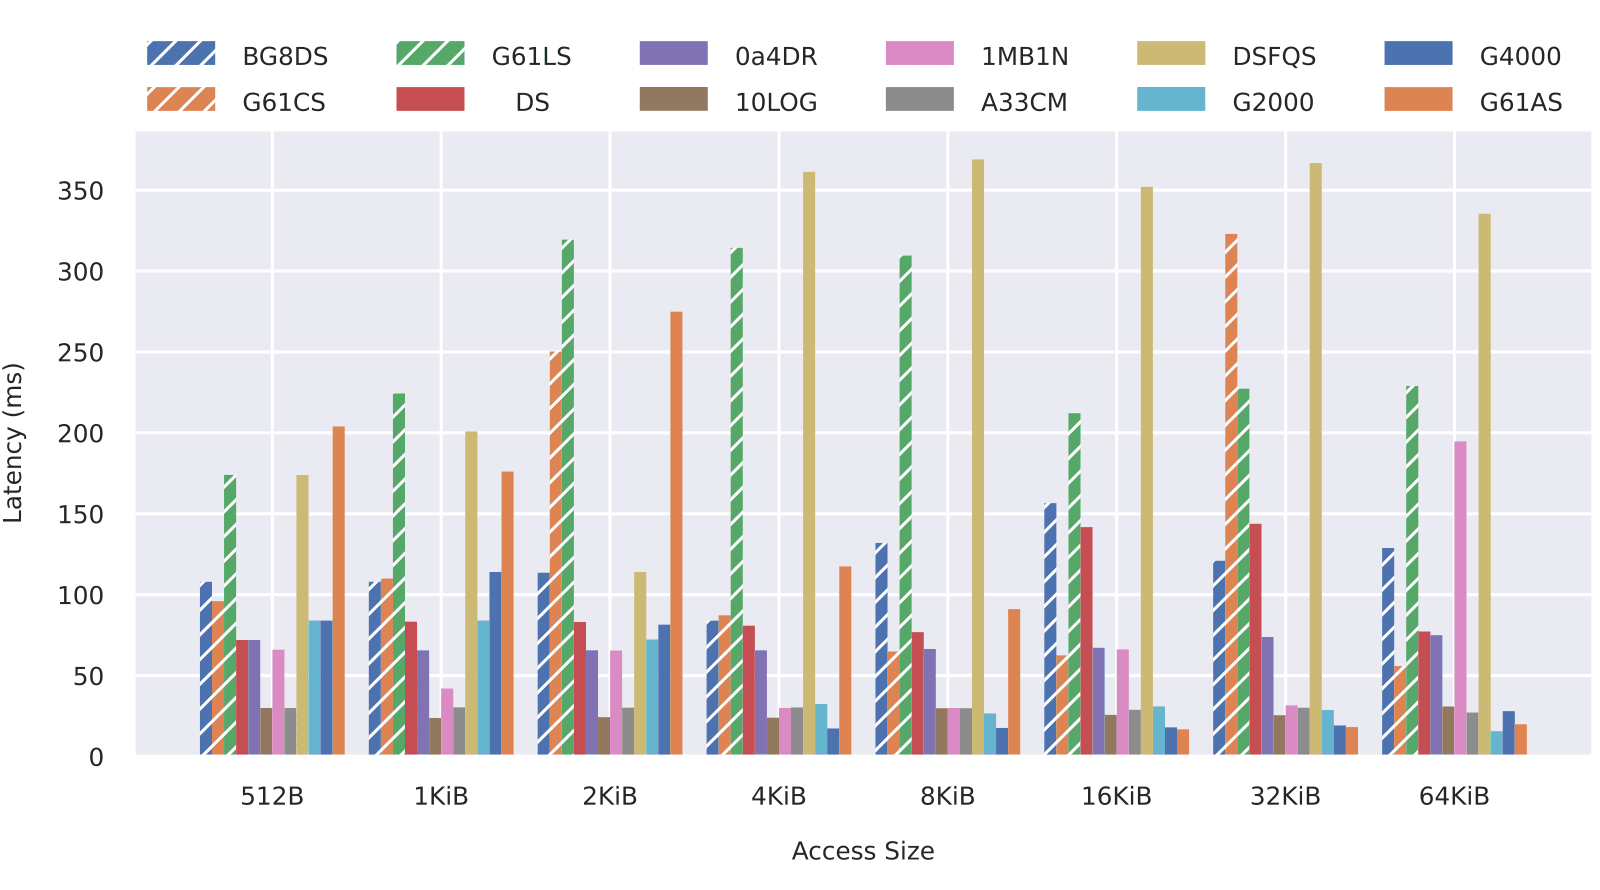
Looking at the results, we can see that some cards behave much better than others even though their average throughputs, on the other hand, are similar. Take the Sandisk Industrial SDHC (G61AS) and the Micron i200 (A33CM) for instance. Their respective average write throughputs are not very far apart. However, the maximum write latency measured on the Micron card is below 50 ms while the Sandisk exceeds 500 ms. Also, comparing figure 6 and figure 8, we can see that some cards have very decent maximum read latencies but extremely high write latencies. Again, this asymmetry is not apparent from the average throughput results, which highlights the importance of maximum access time measurement.
Access Time Statistical Distribution
Another way to look at SD card performances is through the access time distribution. Figure 10 and 11 show the random write access time distributions for the Sandisk Industrial (G61AS) and the Micron i200 (A33CM) cards respectively.
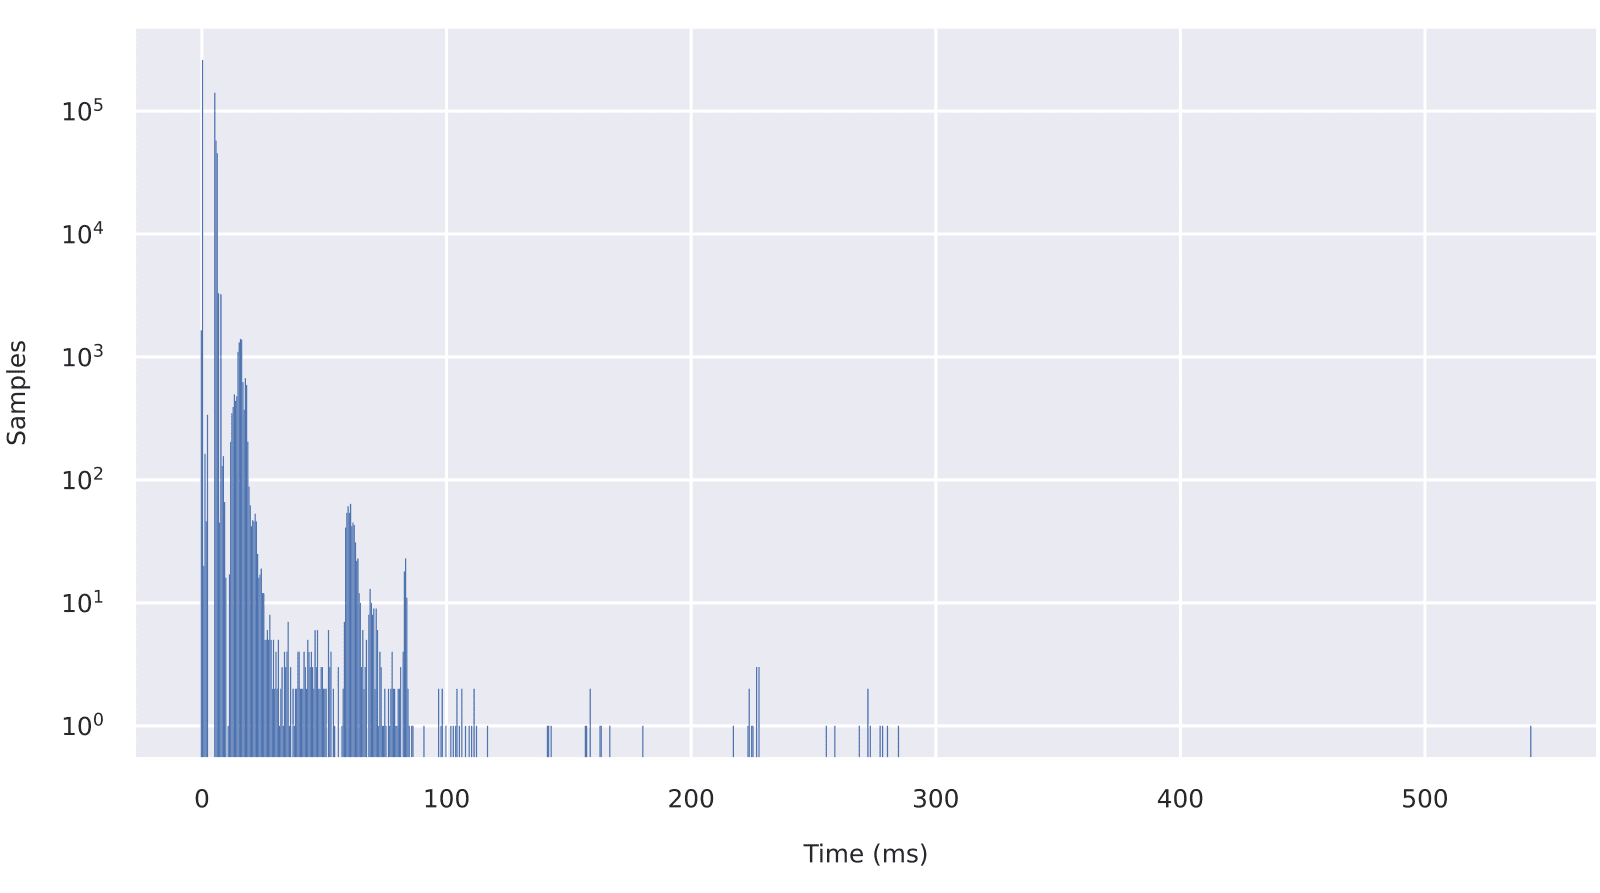
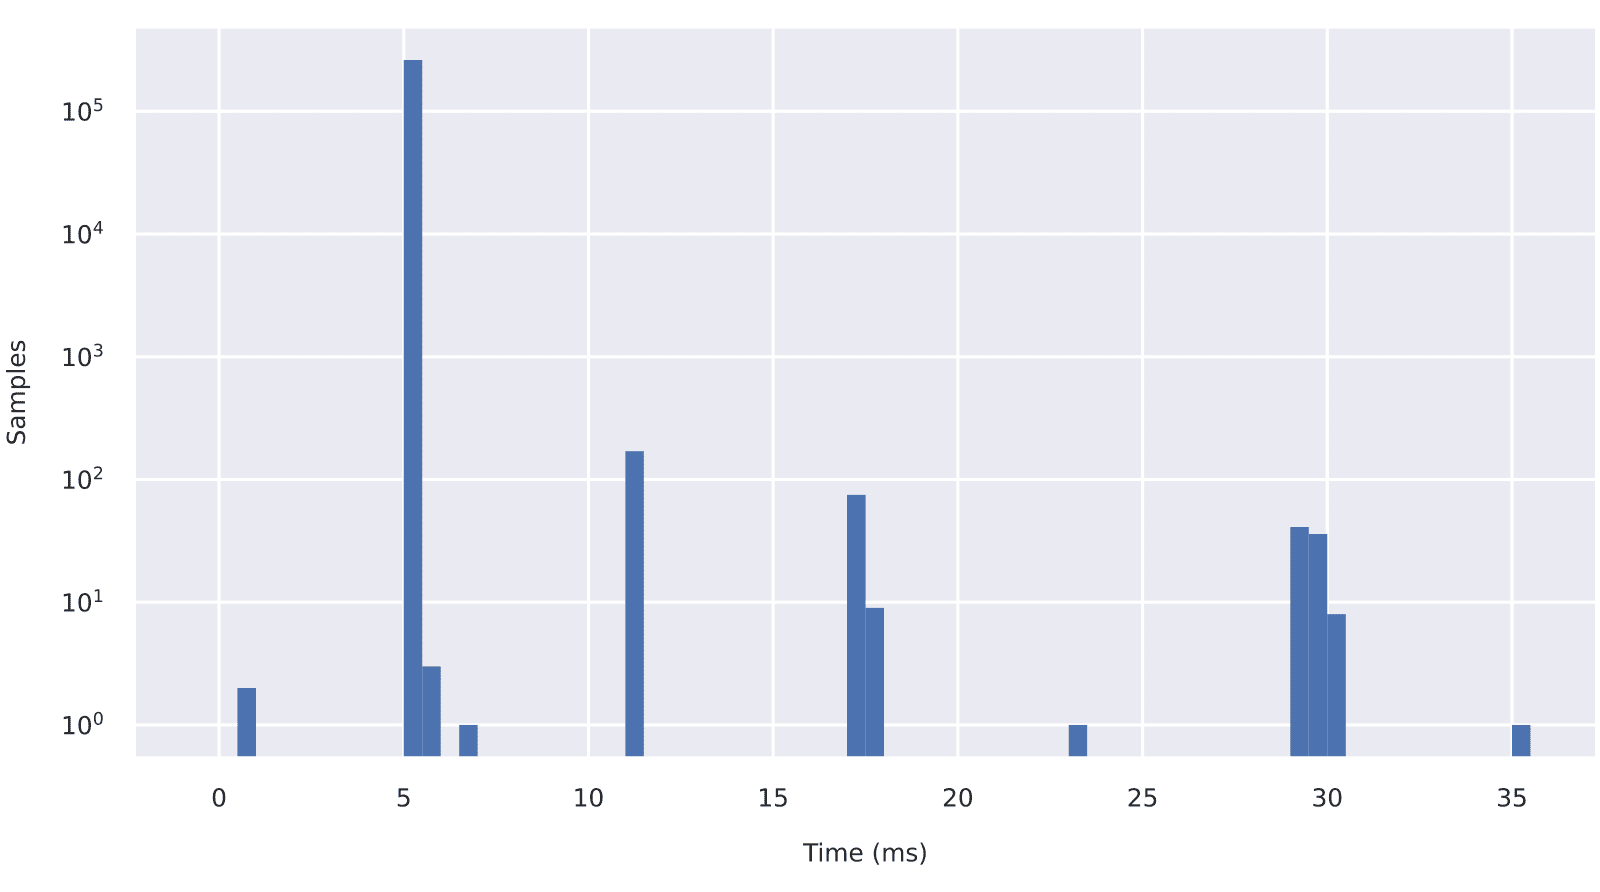
We can see that the SanDisk card (G61AS) has a wider access time distribution than the Micron card (A33CM). This alone is a cause for concern but the main issue is elsewhere. It is somewhat of a hidden problem, one that the statistical distribution does not show very well.
In order to evaluate the highest achievable net throughput, we need to know how close latency spikes can be from each other. This is important because a long streak of higher-than-normal access times (as opposed to evenly spaced latency spikes) could cause an input buffer to overflow even though its size has been calculated to absorb the maximum possible access time.
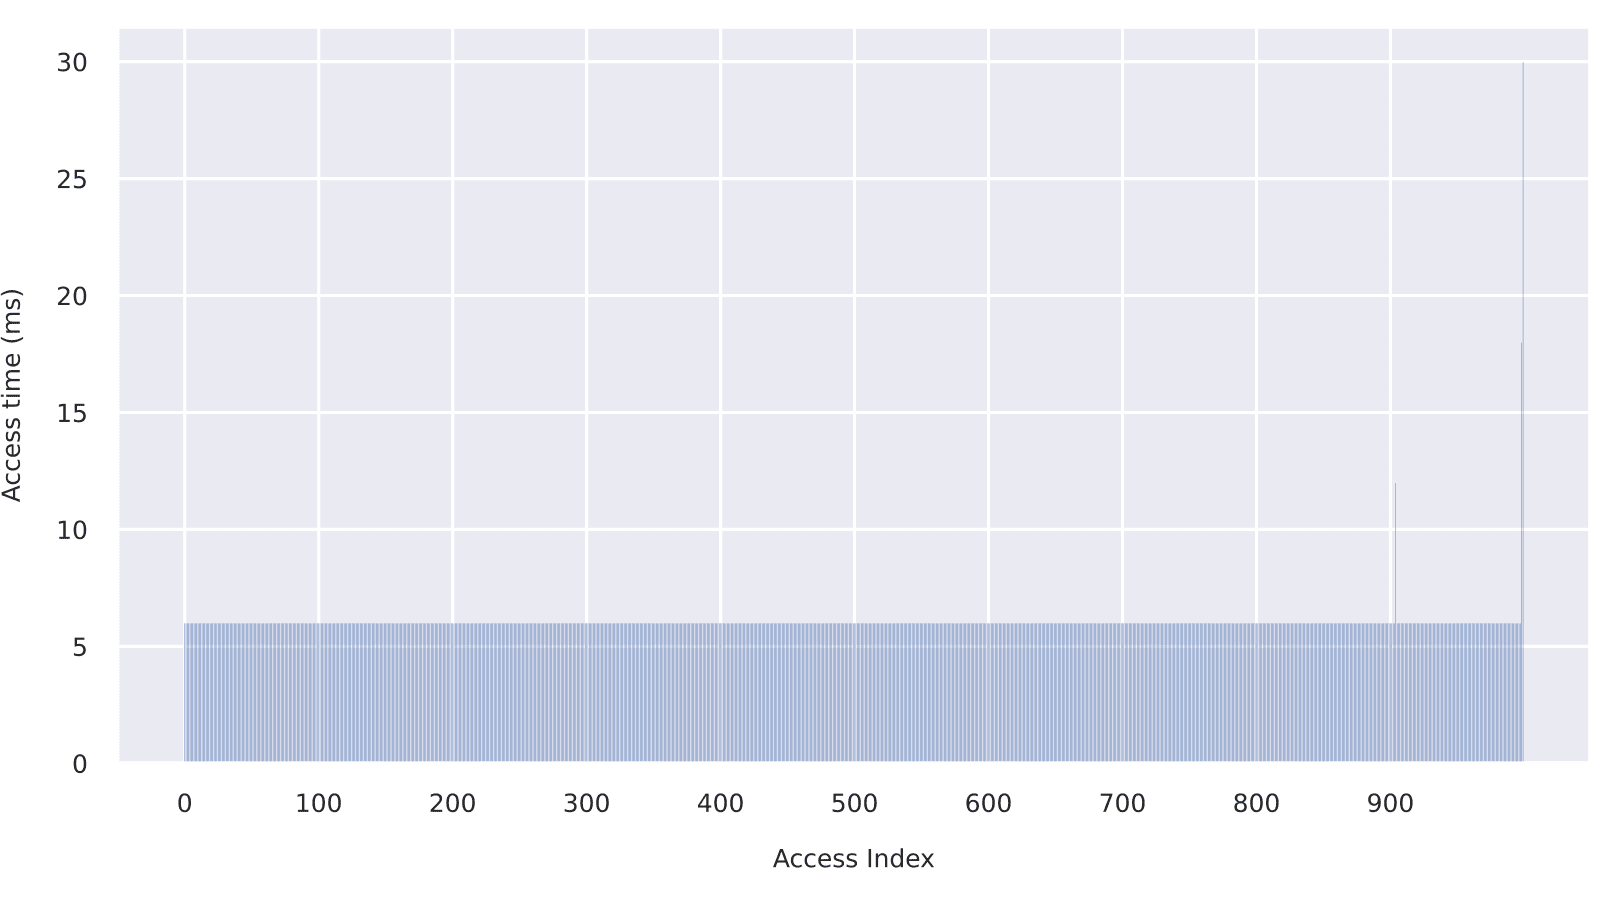
Access Time Temporal Distribution
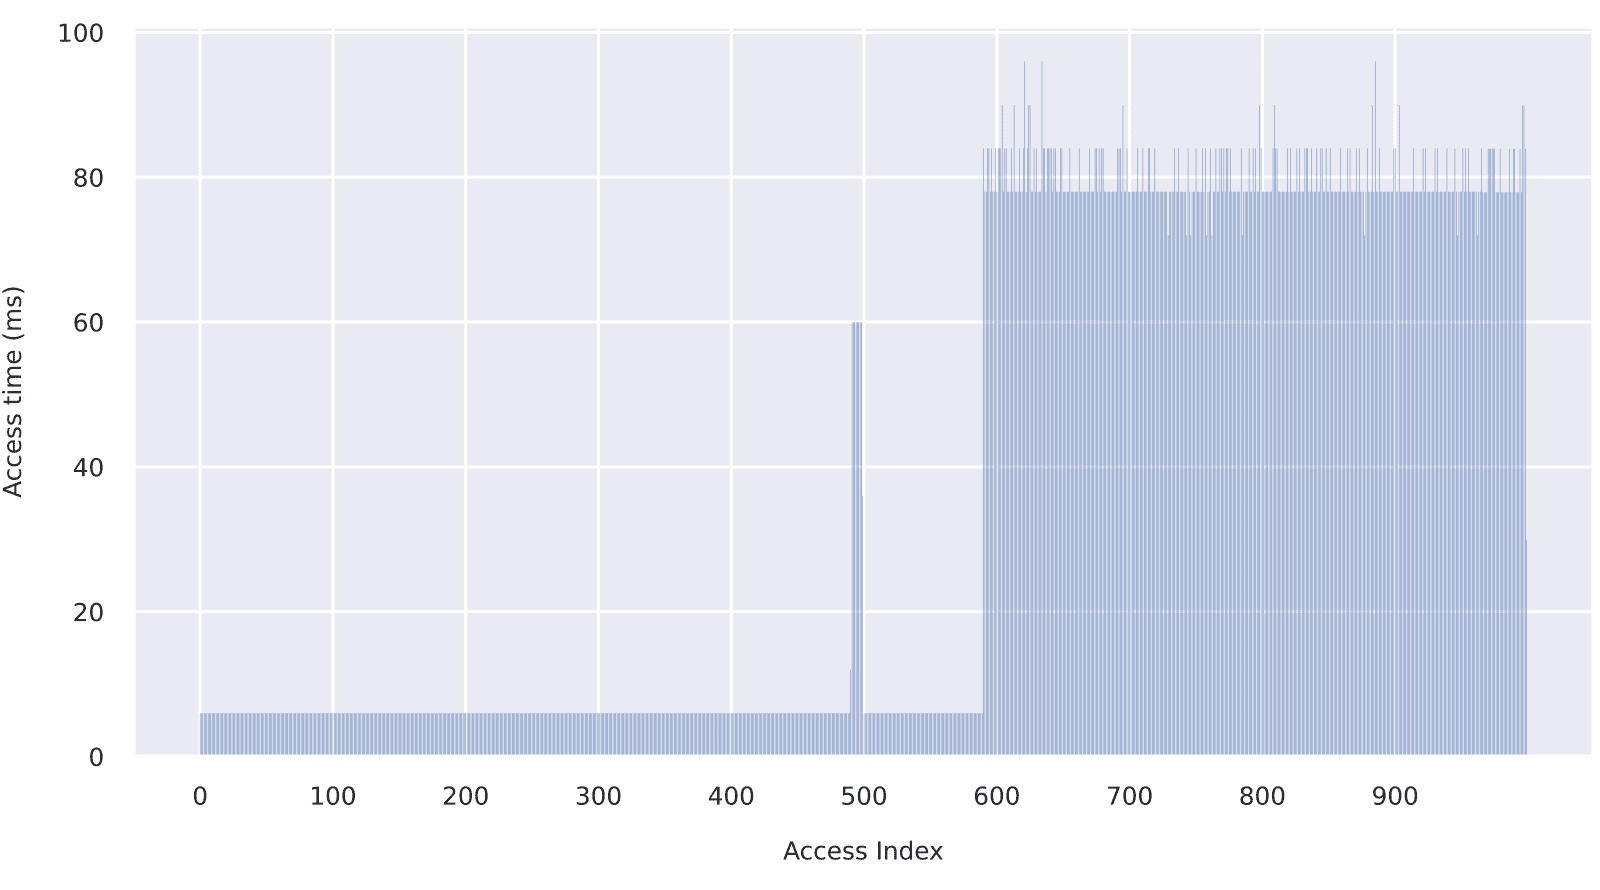
To better understand the importance of access time temporal distribution, take a look at figure 12 and 13. These graphs show the time window with the worst average access time (here we use a one-thousand-access window size). The difference between the two figures is dramatic. In the case of the Micron i200 (A33CM), a few kilobytes of buffering would be enough to absorb the few latency spikes and sustain an input rate approaching the average write throughput of the card. On the other hand, the SanDisk Industrial (G61AS) produces a long streak of latency spikes that would require hundreds of kilobytes of buffering. Alternatively, the flow of incoming data could be reduced down to a more manageable level at the expense of a lower net throughput.
Takeaways
- All SD cards are not equal. Although access performances consistently improve with access size, absolute performance numbers can vary dramatically between individual SD cards.
- Benchmarking is essential. Performance data provided by SD card manufacturers is usually limited to average access throughputs, which is not enough to realistically estimate the performance level that can be obtained on a given platform. The official SD card specification does define upper bounds for access time, but those are very loose and thus, of little help from a design perspective.
- Industrial-grade cards are not simply about access performance. Although industrial-grade cards generally have better access performances than consumer-grade cards (especially in terms of access time distribution), their benefits go much further. Industrial cards come with more precise specifications regarding mechanical stress endurance, temperature ranges, power consumption and other technical considerations that are crucially important for industrial applications. Moreover, they typically come with advanced monitoring features (e.g. S.M.A.R.T.) allowing for rigorous lifecycle management.
- Access time distribution is paramount. As we have seen, it is not so much the maximum access time that matters, but rather the temporal distribution of latency spikes which, ultimately, limits the maximum achievable throughput for a given amount of memory. An irregular distribution characterized by clusters of latency spikes may not be a problem on a Desktop PC with plenty of cache, but is likely to create a bottleneck on a more modest embedded system.
If you have any questions or would like some guidance about selecting the best flash device or file system for your application please do not hesitate to contact us.